Ethereum shows strength, Bitcoin rages on
The super altcoin has increased by more than 2 for the day. At the time of writing, it had recovered the $2,700 level and was up more than 10% over the previous seven days.
On-chain analysis shows that over 74% of ETH holders have held their tokens fo over a year.
According to the most recent data from CryptoQuant, there are more than 19 million Ethereum (ETH) addresses in accumulation. From October 18 to January 2024, the total amount of Ethereum in accumulation addresses nearly doubled.
In the first month of 2024, there were 11.5 million of them. at least one analyst predicts it will exceed 20 million by the end of this year
The CryptoQuant researcher emphasized that Ethereum has been more accessible to individuals and institutions after the Securities and Exchange Commission authorized spot Ethereum exchange-traded funds (ETFs).
The analysis also predicts that the value of the accumulation addresses will surpass the worth of the world’s top firms by the end of 2024 when address holdings reach 20 million ETH.
Additionally, the analyst projects that the combined value of these holdings will reach $80 billion, with Ethereum trading at about $4,000.
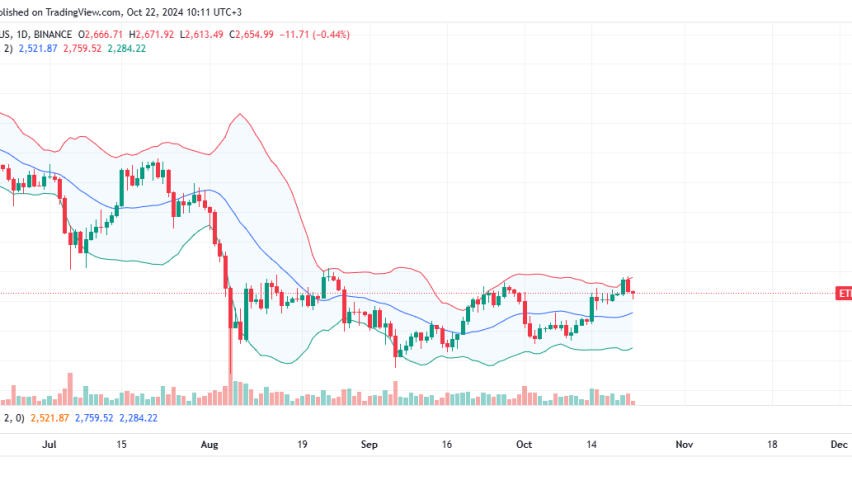
Approximately 23% of holders have kept their Ethereum for one to twelve months, while just 3% have held it for less than one month. After finding support around its 50-day Exponential Moving Average (EMA) of $2,564 on October 15, the price of Ethereum approached its falling trendline on Monday, which was established by connecting many high levels from the end of May.

ETH may initially rise to retest its daily resistance level at $2,927 if it breaks and closes above its falling trendline around $2,820. Such a rally might continue if $2,927 is closed successfully, reaching $3,236, the weekly resistance.
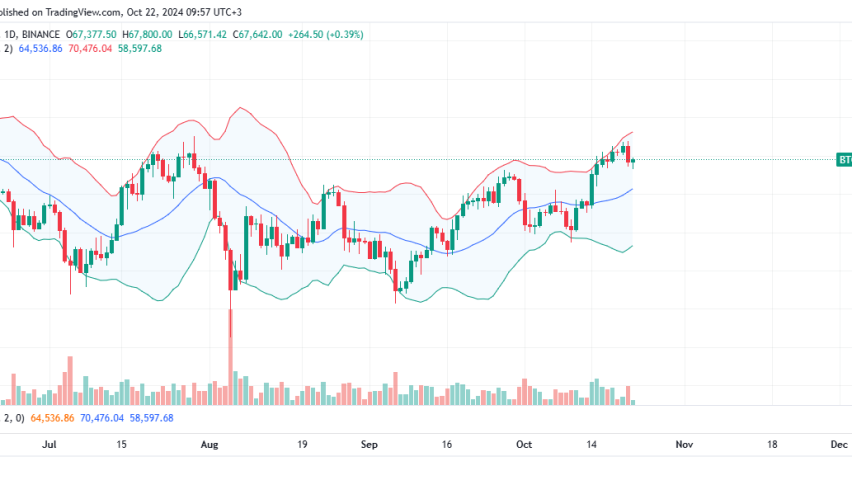
Bitcoin is approaching its July 29 high of $70,079 on Monday, with a 2.7% increase and a breakthrough beyond the critical $66,000 barrier on October 15,
Recent price action shows if Bitcoin breaks and closes over $70,079, it might surge and hit its all-time high of $73,777.
The Relative Strength Index (RSI) indicator on the daily chart approaches the overbought level of 70. It will close in the zone, which increases the probability of a decline, therefore traders will be advised not to add to their long holdings. It’s also possible, that the rise continues and the RSI stays in the overbought region.