


Forex Signals Brief October 18: Chinese and UK Retail Sales Close the Week!
Yesterday started with the employment report from Australia, which came stronger than expected, showing a resilient labour market. The unemployment rate ticked lower as well, which gave the AUD a boost, with AUD/USD closing higher, while all other major currencies lost against the USD.

The main focus of the market was on the ECB decision. Following President Lagarde’s announcement of a rate cut and dovish commentary, the euro declined amid signs that the central bank might be lagging in its economic assessment. After touching a two-month low, the euro closed above 1.08.
Additionally, strong US retail sales and better-than-expected initial jobless claims led to broad USD strength, which also lifted Treasury yields and pushed the USD/JPY pair above 150.00. Gold reached a new record high, just shy of $2,700, marking its third day of gains, likely influenced by mounting disappointment in Chinese equities.
Today’s Market Expectations
Today we have a round of economic data from China. Expectations are that China’s Q3 GDP will slightly decline year-over-year to 4.6%, down from Q2’s 4.7%. Citing weaker retail and industrial production data in August, Citigroup and Goldman Sachs recently revised their 2024 growth forecasts for China down to 4.7%. Notably, retail sales growth slowed to 2.1% from July’s 2.7%, and industrial output fell to 4.5% year-over-year in August, from 5.1% in July. Analysts are closely monitoring the impact of new stimulus measures from China’s People’s Bank (PBoC) unveiled in late September. However, the efficacy and timing of the stimulus are uncertain due to the lack of a substantial fiscal update. While a month-over-month value of 0.0% is expected (a marked decrease from the prior 1.0%), the potential for a larger fiscal announcement remains.
Later we also have the UK Retail Sales with a predicted range that bottoms out at -0.4%, an M/M value of 0.0% is anticipated, which is significantly lower than the 1.0% previous reading. As consumers wait for a possibly big fiscal update at the end of October, this reading is anticipated to be an unwinding of previous momentum, which was driven by real-wage improvements for households. According to latest retail metrics, BRC Retail Sales increased from 0.8% to 1.7% year over year in September.
Yesterday most markets picked some pace in the US session in particular, and the USD pushed higher, although we saw a reversal in the price action late in the US session, with the USD and stock markets retreating from the highs. We ended the day with 4 closed trading signal, out of 7 trades issued during the day. Three of them were winning forex signals, and just a losing trade.
Gold Continues to Respect the Triangle
Gold prices fell earlier last week as financial markets shifted their risk sentiment, driven by the absence of a broader conflict in the Middle East. However, support near the 20-day Simple Moving Average at around $2,605 helped gold stage a recovery, further fueled by developments in China. As global uncertainty continues to push buyers toward safe assets, gold broke its September high of $2,685 and set a new record today at $2,696.74. Investment flows into safe havens like gold and silver are gaining momentum, supported by rising geopolitical tensions and central banks’ dovish monetary policies.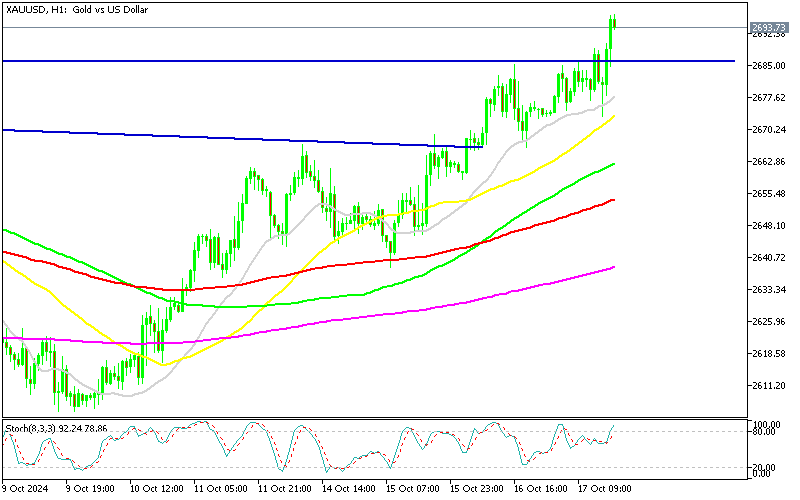
XAU/USD – Daily Chart
NZD/USD Approaches 0.60
Since the beginning of October, the NZD/USD exchange rate has been steadily declining. This week, it dropped below 0.61, moving closer to its initial target of 0.60. Although the pair closed slightly higher last week, boosted by the Reserve Bank of New Zealand’s 0.50% rate cut, sellers managed to drive the price back down below the 0.61 level. As a result, the pair has now settled into a swing range between 0.6039 and 0.61. For the downtrend to gain more traction, the price needs to fall below 0.6030, which would open the door to a move toward 0.60. This level lies just above a critical support zone at 0.5850, which represents the lows from April and August of this year.
NZD/USD – Weekly Chart
Cryptocurrency Update
Bitcoin Returns Above $67K

BTC/USD – Daily chart
Ethereum Consolidates below the 100 Daily SMA
Ethereum has faced similar selling pressure since March, briefly rallying to the 50-day SMA by June. It remains range-bound near $2,200, with the 100-day SMA now acting as overhead resistance at $2,500. Broader economic concerns have kept it from breaking above key resistance levels, even as it continues to consolidate within this range.
ETH/USD – Daily chart


🏆 7 Best Forex Brokers
| Broker | Website | |
|---|---|---|
| 🥇 |  | Visit Broker |
| 🥈 | Visit Broker | |
| 🥉 | Visit Broker | |
| 4 |  | Visit Broker |
| 5 |  | Visit Broker |
| 6 |  | Visit Broker |
| 7 |  | Visit Broker |