Gold Price Forecast: Weakness Ahead as Prices Slip Below $2,650 Amid Fed Speculation
Gold prices remained flat on Tuesday as investors awaited clarity on potential U.S. interest rate cuts by the Federal Reserve.

Spot gold was trading at $2,646.64 per ounce, holding steady since the previous session. Last month, gold hit a record high of $2,685.42, but the recent market focus has shifted to the Fed’s monetary policy and its implications for bullion prices.
Costco $COST is selling hundreds of millions of dollars worth of gold bars each month. They don't release the exact details but have said many times the demand is there. Below is the current price for a 1oz gold bar in Canada. The current USD price is $2,650 – at the current FX… pic.twitter.com/vHolFJ3onz
— Coffee Capital (@Coffee__Capital) October 14, 2024
The upcoming U.S. elections and uncertainty around economic policies are expected to fuel gold demand, especially as investors seek safe-haven assets. Analysts predict that gold prices could rise to $2,800 by year-end if the Fed opts for incremental rate cuts of 25 basis points. With the dollar climbing to a two-month peak and Treasury yields inching higher, gold remains under pressure for now.
Fed Rate Cuts: Impact on Gold Prices
Comments from Federal Reserve officials have sparked speculation regarding future rate cuts. Fed Governor Christopher Waller emphasized caution, while Minneapolis Fed President Neel Kashkari indicated further reductions might be on the horizon as the central bank works toward its 2% inflation target. The CME FedWatch tool shows an 87% probability of a 25-basis-point cut in November, which could improve the appeal of holding non-yielding assets like gold.
Lower interest rates generally boost the attractiveness of gold, and with rate cuts on the table, gold could regain its bullish momentum in the near future. Central banks have also remained strong buyers of gold, further contributing to its long-term value as a reserve asset.
[October 15, Asian Session] #XAUUSD
Gold fluctuations continue to test the support at the critical $2,650 level, which is key for bears to overpower the bulls. We should have an answer in the next few days.
Range: International $2,636 – $2,658. pic.twitter.com/56RjXJ5iUC
— Forex analyst (@Daniel259219690) October 15, 2024
Gold Price Technical Outlook
Gold prices are currently showing signs of weakness after completing a 38.2% Fibonacci retracement, now trading around $2,642. Immediate resistance is seen at $2,651, with further resistance levels at $2,659 and $2,665. Failure to surpass these levels could lead to a deeper correction. On the downside, immediate support lies at $2,635, followed by $2,628 and $2,617, which align with the 61.8% Fibonacci retracement.
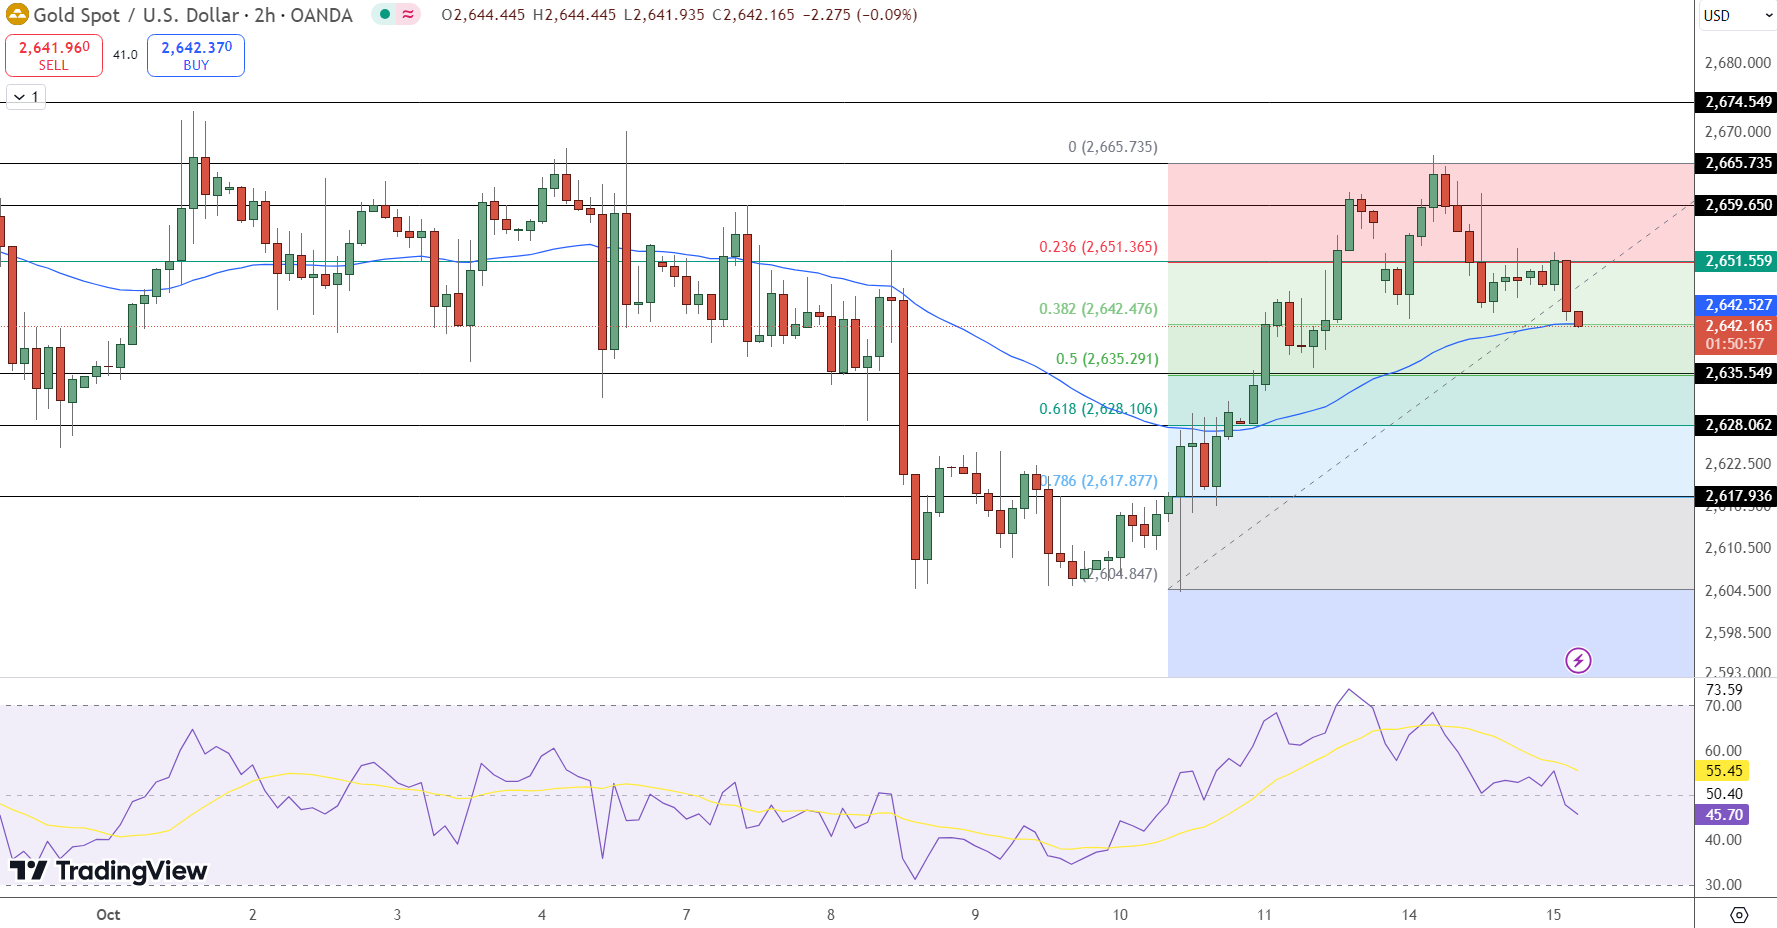
The 50-day EMA at $2,642.52 is providing a key pivot point, but gold has yet to reclaim this level convincingly. The Relative Strength Index (RSI) is currently at 45.70, signaling mild bearish momentum, which could lead to additional selling pressure in the short term.
Key Insights:
Immediate Resistance: $2,651
Support Levels: $2,635, $2,628
RSI: 45.70, signaling bearish sentiment
Conclusion:
Gold is under pressure, with the potential for further downside after completing its Fibonacci retracement. If the support at $2,635 does not hold, the market could see a deeper correction as investors await more clarity from the Federal Reserve on interest rate policies.