Forex Signals Brief October 3: Swiss CPI and ISM Services
Yesterday the economic data was light and markets calmed down somewhat. The Japanese yen experienced a significant drop earlier in the day, largely driven by comments from Prime Minister Ishida, who signaled that rate hikes were not being considered. This decline was further intensified by Bank of Japan Governor Ueda’s remarks, indicating that markets “remain unstable,” suggesting that rate increases are unlikely in the near term.

Later in the US session, stronger-than-expected ADP employment data for September, showing job growth of 143K compared to the 120K forecast, added to market dynamics. Stock markets also saw a slight rebound after Tuesday’s declines, buoyed by the absence of any immediate response from Israel.=
Today’s Market Expectations
Switzerland’s year-over-year CPI is the main event for the day and it is forecasted to remain at 1.1%, the same as the previous year, while the month-over-month figure is expected to dip to -0.1% from the prior 0.0%. Last week, the Swiss National Bank (SNB) reduced rates by a modest 25 basis points, bringing the policy rate to 1.00%. The SNB also mentioned it is prepared to intervene in the foreign exchange market if necessary. Despite lowering its inflation forecasts, the market reacted by pricing in further rate cuts into 2024. However, the Swiss Franc appreciated, likely due to market perception that the move was too cautious.
Meanwhile, the US Jobless Claims report remains a key indicator for the labor market. Initial Claims have stayed within the 200K to 260K range since 2022, while Continuing Claims, which rose throughout the summer, have seen improvement recently. For this week, Initial Claims are expected to reach 220K, slightly up from last week’s 218K. However, there is no consensus on Continuing Claims at the moment, with the previous report showing an increase to 1.834 million.
The US ISM Services PMI is expected to edge up to 51.6 from 51.5, though this measure has been range-bound since 2022 and hasn’t provided strong signals. The market may focus on the employment index ahead of tomorrow’s Non-Farm Payrolls (NFP) report. Meanwhile, the latest S&P Global Services PMI suggests the economy is still growing at a robust pace, potentially signaling a positive surprise in the ISM Services reading.
Yesterday the volatility calmed and USD continued the upside momentum after the positive Unemployment Claims numbers. We had another great day with our forex signals, remaining mostly long on the UD again. We had seven closed trading signals, six of which edned up as winning forex signals.
The 50 SMA Keeping Gold Supported
Gold prices have been climbing in 2024 due to heightened political, geopolitical, and economic uncertainty, which has kept demand for safe-haven assets strong. After peaking at $2,685 last Thursday, gold dipped to $2,624 by Monday. However, the 50 SMA (yellow) on the H4 chart offered significant support. Escalating tensions in the Middle East, including Israeli forces entering Lebanon and an Iranian missile strike, pushed XAU/USD higher, but the price failed to set a new high and reversed lower during the European session. Nevertheless, the 50 SMA continued to provide support, prompting traders to reopen gold purchase signals.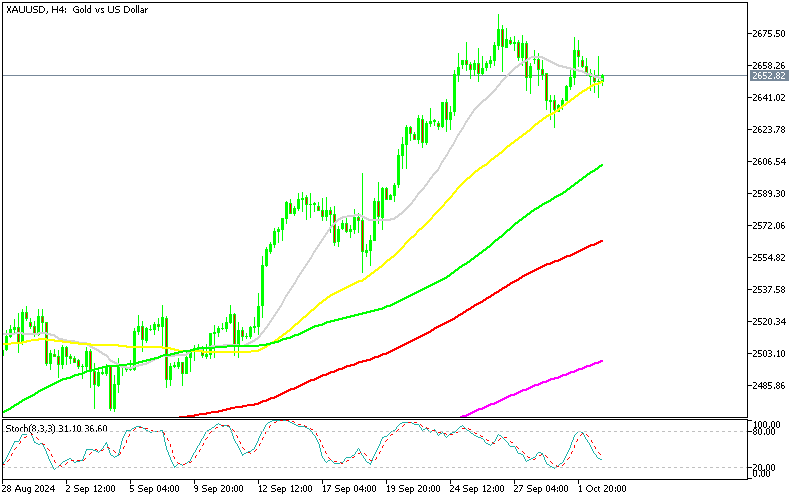
XAU/USD – H4 chart
EUR/USD Head to 1.10 After Failing to Break 1.12
As for EUR/USD, the pair has retested the 1.12 level several times but now appears headed toward 1.10 as buyers have been unable to push through that resistance. The outlook for the Euro has turned bearish, with a sluggish Eurozone economy and a reduced likelihood of a 50-basis-point Fed rate cut in November. In June and July, EUR/USD showed significant strength, rising from below 1.07 to 1.12, but after an August dip, the pair stalled around 1.12 before fundamentals shifted in favor of the USD. The technical indicators also point to a bearish reversal, as EUR/USD has broken below a key triangular pattern, with the 100 SMA now acting as resistance—a classic sign of a potential downtrend.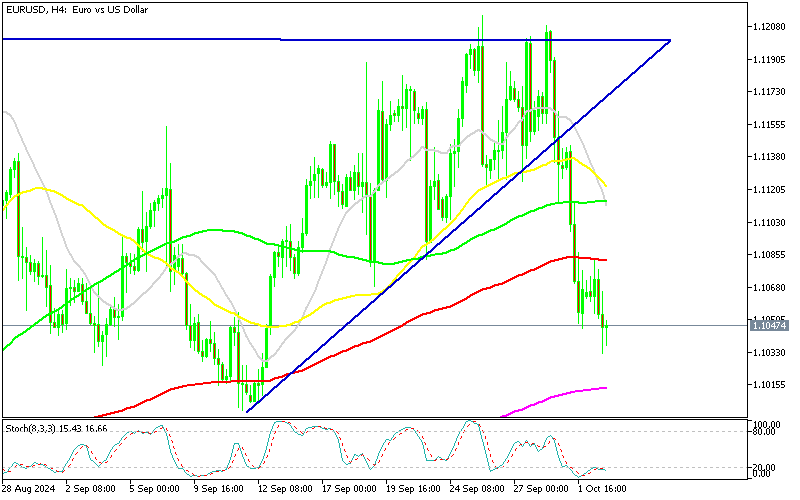
EUR/USD – H4 Chart
Cryptocurrency Update
Bitcoin Falls to $60,000 on Risk Aversion

BTC/USD – Daily chart
Ethereum Returns Below $2,500
Similarly, Ethereum has been declining since March, falling from $3,830 to under $3,000 by June. Continued selling pressure drove prices down to $2,200 before a brief recovery above the 50-day moving average. Currently, the 100-week SMA is providing strong support, but the 50 SMA (yellow) has become resistance, keeping ETH/USD trading below $2,500.
ETH/USD – Weekly chart