


Forex Signals July 22: BOC, US GDP, PCE to Highlight the Week
Last week we saw a sudden shift in market sentiment, as the USD has been retreating for two weeks made a bullish reversal, while risk assets turned lower. This could have been due to the risk-off sentiment in financial markets after some weaker Q2 China GDP figures released on Monday, but safe havens such as Gold and the CHF also turned lower, leaving the USD as the sole winner.

This indicates that the tone in the markets last week was sent by the political events in the UK, following the failed assassination attempt of Donald Trump, which has given him a massive lead against Biden, who announced his pulling out of the presidential race. This makes the situation a bit more confusing for forex traders, but the trend has been set.
On Tuesday, the CPI inflation report from Canada showed another slowdown, which solidified another 25 bps rate cut by the Bank of Canada this week. In the US, June retail sales were expected to show another decline, but they came in positive and the revisions from the previous month were also positive. This calmed fears of a faltering US consumer, which aided the USD further on its uptrend. The ECB left everything unchanged, so markets are expecting a September rate cut from them.
This Week’s Market Expectations
This week the economic calendar is very light in the first half, with only the People’s Bank of China (PBoC) Loan Prime Rate (LPR) decision, However, we have some important forex events in the second half, starting with the Services and Manufacturing PMIs and the BOC decision on Wednesday, followed by the US Q2 Advance GDP report on Thursday and the PCE on Friday, which is the FED’s preferred inflation report.
This Week’s Upcoming Events
Monday:
- People’s Bank of China (PBoC) Loan Prime Rate (LPR) announcement
Wednesday:
- Flash Purchasing Managers’ Index (PMI) for Japan, Australia, Eurozone, UK, and US
- Bank of Canada (BoC) policy decision
Thursday:
- US Durable Goods Orders
- US Initial Jobless Claims
- US Q2 Advance Gross Domestic Product (GDP) report
Friday:
- Tokyo Consumer Price Index (CPI)
- US Personal Consumption Expenditures (PCE)
Last week markets were very volatile, with risk assets and safe havens surging higher in the first half in continuation of the previous weeks, so we kept buying such assets against the USD. But the situation shifted by midweek, which sent the USD surging and everything else tumbling lower. We opened 37 trading signals in total, ending the week with 27 winning forex signals and 10 losing ones.
Gold Retreats $40 After Printing A New High
The Gold price (XAU/USD) hit a new peak of $2,483 on Wednesday but then started a downward trend, falling for three consecutive days and dipping below $2,400 during Friday’s American session. After a significant surge earlier in July, gold prices continued to decline on Friday, reaching a low of $2,393.77 and closing the week right at $2,400.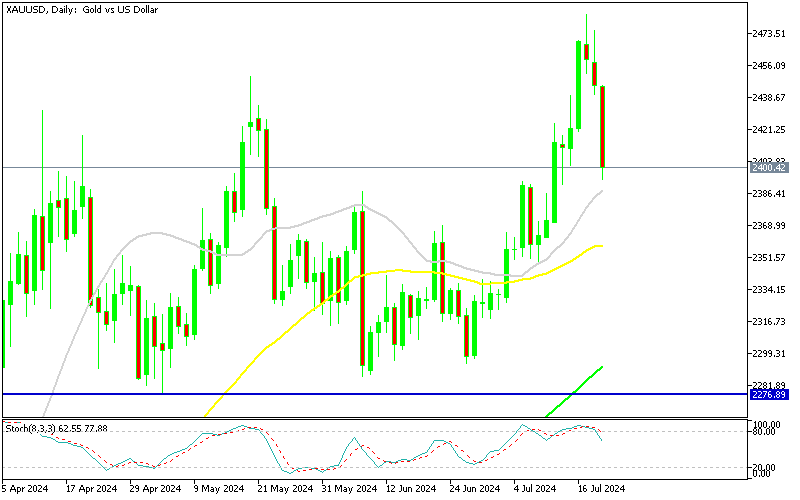
XAU/USD – Daily chart
USD/JPY Bouncing Off the 100 SMA
The previous surge in USD/CHF was driven by the Swiss Franc’s ongoing weakness after the Swiss National Bank (SNB) implemented two consecutive rate cuts in recent meetings. However, the pair has declined over the past two months as the likelihood of the Federal Reserve cutting interest rates has increased due to the weakening US economy. Meanwhile, traders anticipate the SNB will halt rate reductions, providing additional support to the CHF. After briefly rising above the 50-day Simple Moving Average (SMA) (yellow) in May, the price has since dropped to lows of 0.80, falling below all moving averages on the daily chart. Yesterday, the decline intensified, with the pair falling 100 pips, forming a significant bearish candlestick.
USD/JPY – Daily Chart
Cryptocurrency Update
Bitcoin Pushes Closer to $70,000
Bitcoin dipped below $60,000 after experiencing a significant drop earlier this month. The overall cryptocurrency market value declined, with Bitcoin plummeting below $53,000. However, buyers quickly returned, driving the price back above $60,000 and pushing it past key moving averages. The reversal paused around $65,000 for a while, but the 100 SM A(green) turned into support on the daily chart and BTC resumed the uptrend, touching 68K over the weekend.
BTC/USD – Daily chart
MAs Turn into Support for Ethereum
Ethereum has been posting lower highs since early March, despite the launch of the ETH ETF. It reached a peak of $3,830 before reversing lower in June and falling below $3,000 early this month. Buyers then stepped in, pushing the price up to the 50-day SMA (yellow), which acted as resistance but buyers kept pushing and now the 50 SMA is acting as support.
ETH/USD – Daily chart


| Broker | Website | |
|---|---|---|
| 🥇 |  | Visit Broker |
| 🥈 | Visit Broker | |
| 🥉 |  | Visit Broker |
| 4 |  | Visit Broker |
| 5 |  | Visit Broker |
| 6 |  | Visit Broker |
| 7 |  | Visit Broker |
