Bitcoin Price Prediction: 38.2% Fib to Drive Uptrend inBTC?


Bitcoin has struggled to break through the $48,000 resistance level against the US dollar, but BTC reverses gains, but dips may be limited below $46,000. BITCOIN surged above $47,500 and reached a high of $48,200. The price is currently trading above $46,500 as well as the 100 hourly simple moving average (SMA).
On the hourly chart of the BTC/USD pair, a key breakout pattern is forming with support near $46,300. If the pair remains above the $46,000 support level, a new uptrend could begin.
Bitcoin Price Remains Stable
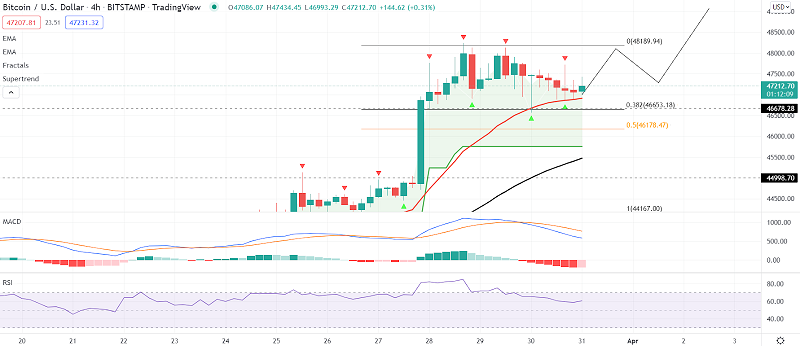
Bitcoin’s price continued to rise above the $47,500 resistance level. BTC even surpassed the $48,000 resistance level, trading as high as $48,200. There has recently been a downside correction from the $48,200 high. The price fell below the 23.6 percent Fib retracement level of the upward move from the swing low of $44,468 to the high of $48,200. It is, however, trading above the 100 hourly simple moving average.
On the hourly chart of the BTC/USD pair, there is also a key breakout pattern forming with support near $46,300. On the upside, the price is encountering resistance near $47,600.
The next significant resistance could be found near the $47,800 level and the triangle trend line. If the price successfully breaks and closes above the triangle resistance, it may move towards $48,200. The next significant upward barrier could be near $49,000. Any further gains could push the price towards the critical $50,000 level.
Dips Accepted in BTC?
If Bitcoin fails to break through the $47,800 resistance level, it may fall even further. On the downside, there is immediate support near $47,000. The next major support level is seen near $46,800. The key support is now forming near $46,400 and the triangle trend line. It is close to the 50% Fib retracement level of the upward move from the swing low of $44,468 to the high of $48,200.
If the price falls below the $46,300 support zone, it could reach $46,000 and the 100 hourly SMA. Any further losses could put the bulls under much pressure in the short term. Good luck!