Forex Pivot Points
When it comes to trading the forex market, pivot points can be very helpful. Forex pivot points are technical indicators which help you identify if the overall trend of the forex market is rather bullish or bearish over given time frames. Forex pivot points are calculated by the average of the high, low and closing prices from the previous trading day. The usefulness of forex pivot points is realized in the following day, as trading above the pivot point indicates bullishness while trading below the pivot point indicates bearishness.
While the pivot point is the foundation for the indicator, it commonly includes other support and resistance levels which are based on the pivot point calculation. Consequently, the projected levels help the trader to find potential price support and resistance levels. In addition to that, if the price surpasses such a level, it means that the likelihood is high that it continues its ongoing trend. Depending on your individual strategy, pivot points correspond to trend lines, Fibonacci levels, RSI, EMA, moving averages, candlestick formations, and several other indicators.

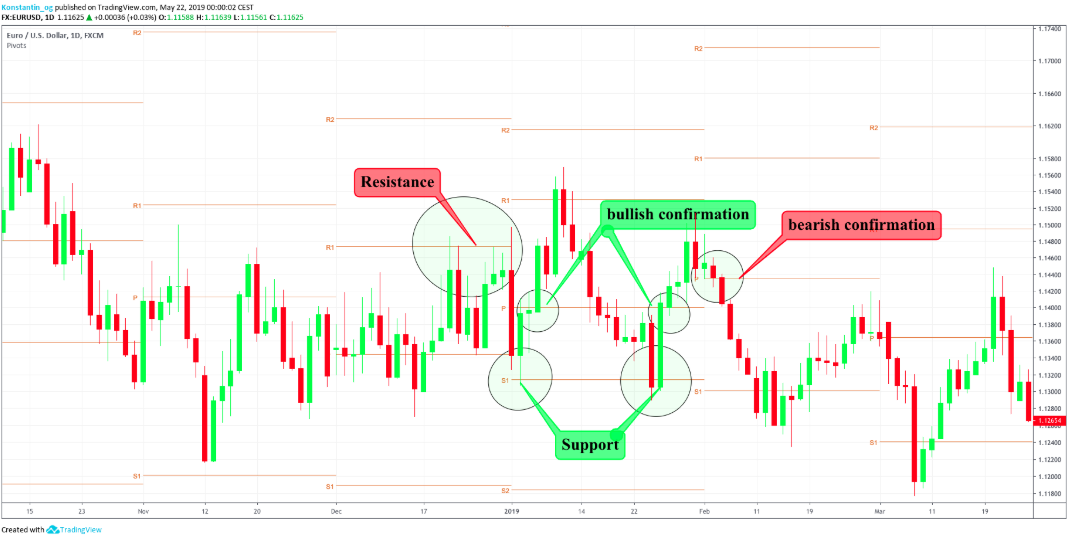
In the example above, you can see how the pivot points acted several times as resistance and support in the forex market, which indicated trend reversals. Apart from that, the surpassing of the pivot point levels acted as bullish or bearish confirmation of each trend, with heavy upwards or downwards movements following after the break of the pivot point levels. You might feel some similarities to the Fibonacci retracement and extension tool at this point.
Difference to Fibonacci levels
Both pivot points and Fibonacci levels help you identify potential support and resistance regions. While Fibonacci retracement and extension levels are usually connected between a low and a high of a current trend, the pivot points are calculated automatically by the previous candles. Also, Fibonacci levels work by percentages, while pivot points don’t use percentages. Forex pivot points are based on fixed numbers: the high, low, and close of the prior day.

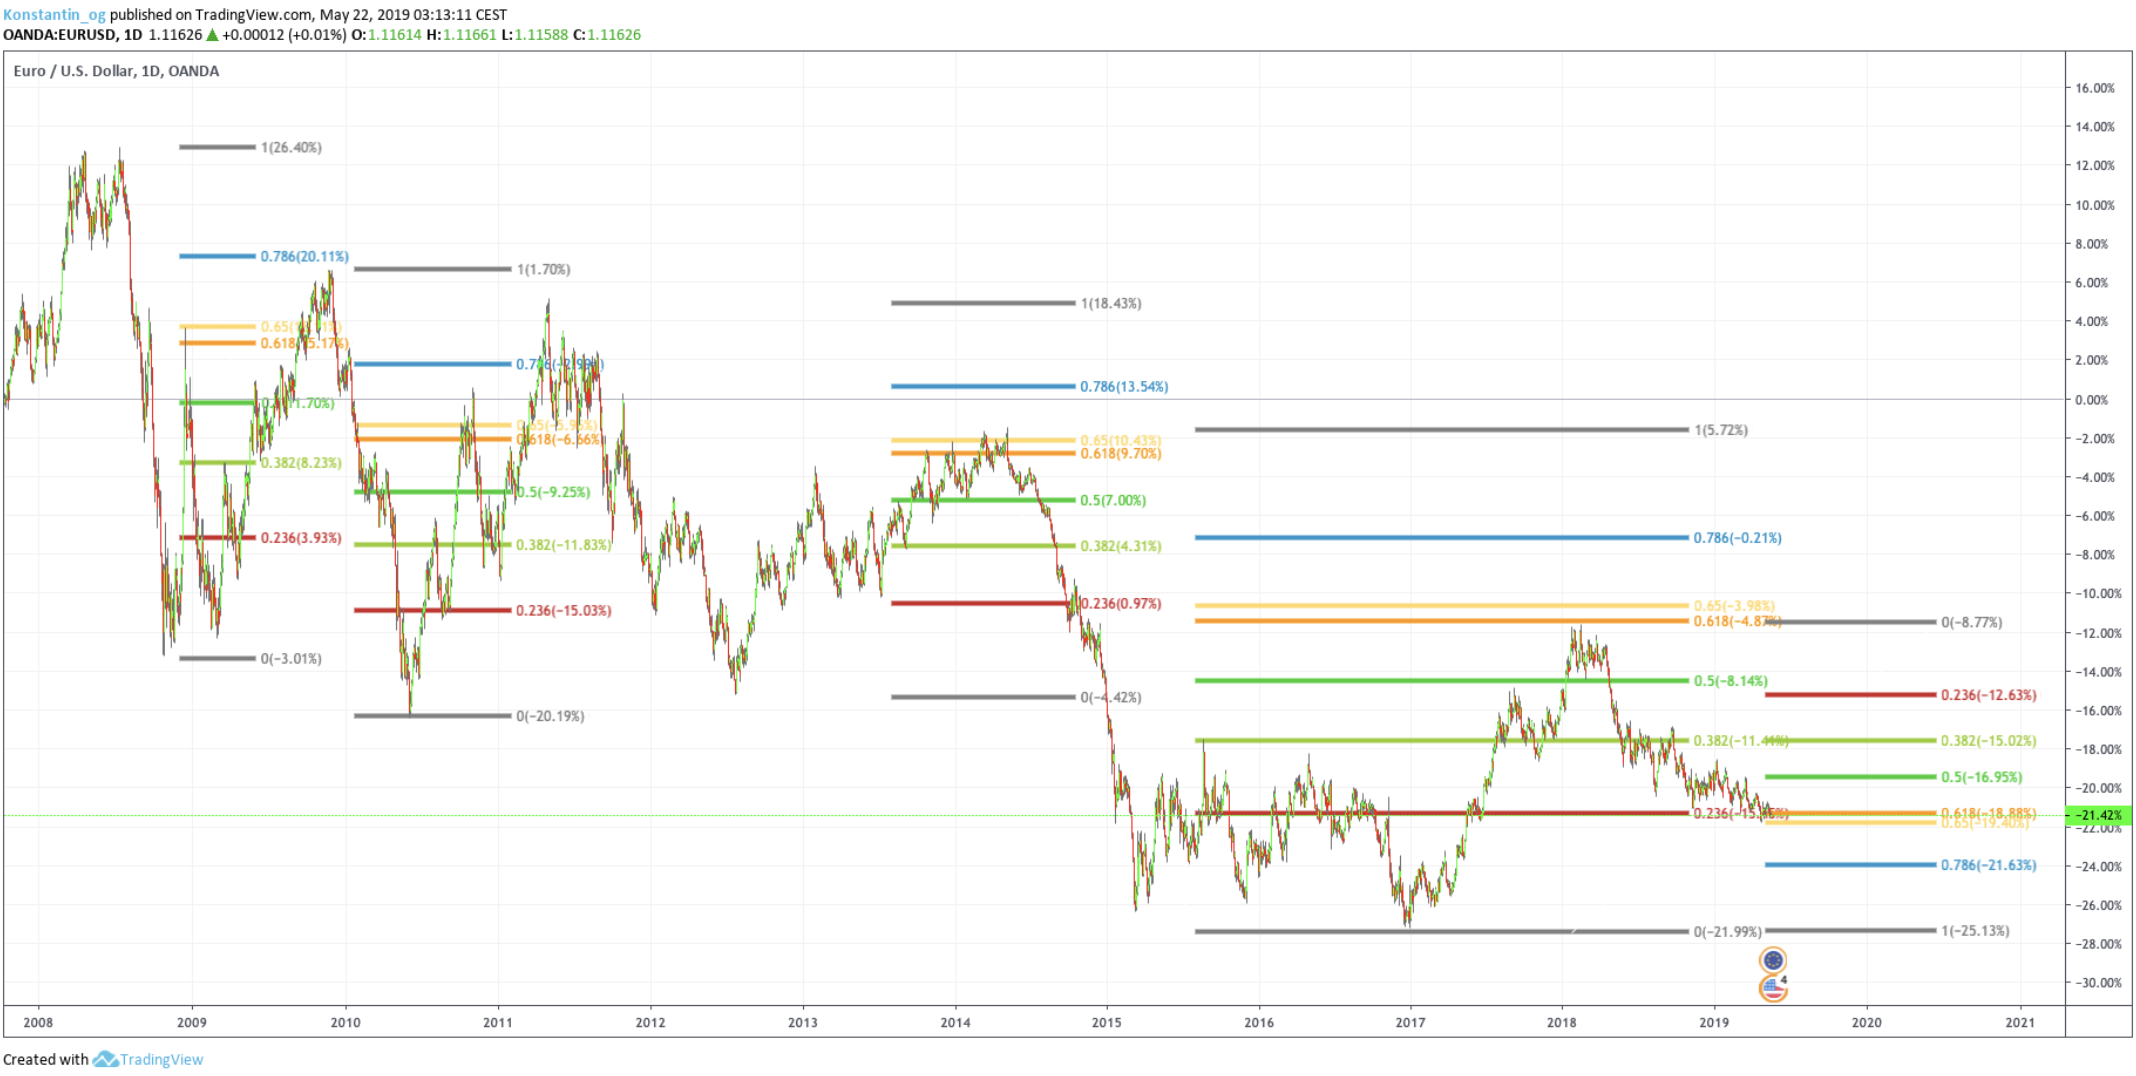
Also, Fibonacci levels are not all equally important whereas forex pivot point levels can be considered as being equally relevant. For instance, the 0.618-0.65 fib level, also called golden pocket, is the most important fib level as the likelihood of a trend reversal is very high at this level. The second most important fib level is the 0.382 fib level. Both act as strong support or resistance and indicate a heavy trend reversal if they successfully hold as support or resistance. If they are broken, a continuation of the trend is very likely. In contrast, 0.236, 0.5 and 0.786 can be considered additional or minor support and resistance levels, where small pullbacks or bounces can occur. However, these levels rarely indicate a heavy trend reversal or continuation.
The current outlook in the example above indicates an upward movement for the EUR/USD pair in the very near future.
Disclaimer
It is important to realize that both indicators don’t give certainties, but probabilities. Trading setups shouldn’t be based on a single indicator; instead, traders should look for a confluence of many different indicators. That being said, pivot points can be very helpful to spot potential trend reversals as well as trend continuations.
Trading strategies
An effective way to use pivot points in the forex market is to short the resistance levels and to long the support levels. Additionally, you could set a stop loss above the resistance level (short) and beneath the support level (long). What’s more, a very interesting trading strategy is to double the amount of your stop loss positions, so that you don’t just exit your original trade, but open up a new trade directly. As a break of the support and resistance levels indicate a continuation of the ongoing trend, traders could typically buy a break of resistances and sell a break of supports.
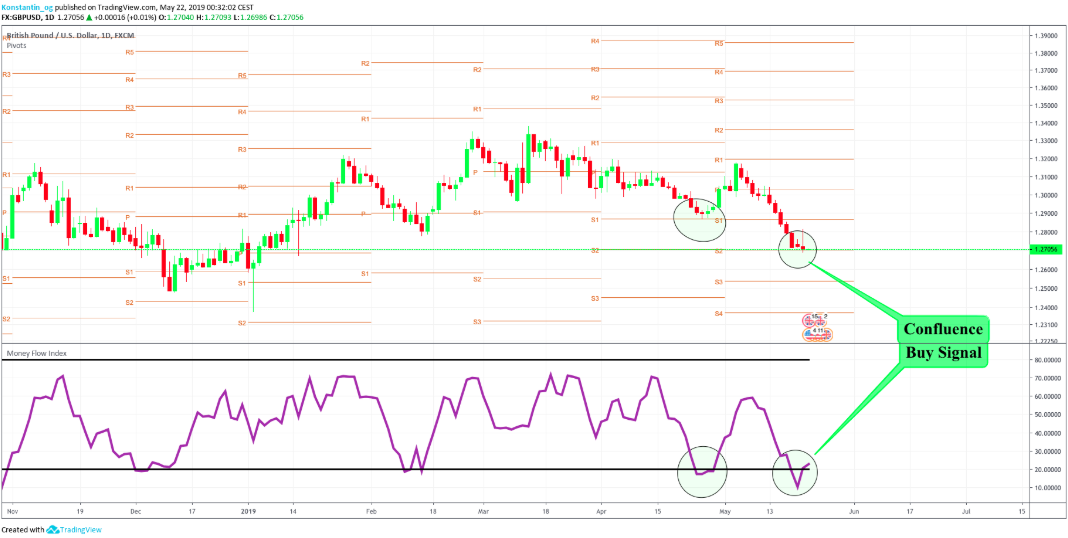
Another possibility would be, as mentioned earlier, to look for confluence. As an example, traders could buy forex pivot point support levels only if the money-flow-index (the volume-weighted RSI) touches oversold regions.

Naturally, and as seen in the example above, the confluence of the two occasions which both indicate a trend reversal is a stronger signal than just relying on one indicator. In fact, the incidence of both indicators indicating a move in the same direction resulted previously in a decent uptrend, which ended at the pivot point resistance.
The Bottom Line
Pivot points can be used to effectively identify overall price trends and trend reversals when applied correctly. They use the previous candlesticks’ high, low and closing levels to estimate areas of support or resistance in the future. For good reason, pivot points may be the most popular leading indicators in forex trading. As there are numerous diverse kinds of pivot points, each with their own formulas and indicators, they can be utilized by many different traders in conformity with various different trading strategies and philosophies.
By combining pivot points with other technical tools, they can also help indicate a large and sudden inrush of traders entering the market at the same time which often leads to breakouts and opportunities for profits for forex traders. Pivot points can be utilized in every timeframe and help forex traders to find entries, exits and stop loss levels. While a day trader can use minute, hour and daily charts to calculate the pivot points each day, a swing trader can look at daily, weekly and monthly data to utilize the pivot points for each week. Interestingly enough, even investors can take advantage of pivot points and use yearly data to estimate important levels for the upcoming year.
To conclude, forex pivot points are useful for most traders regardless of their individual trading philosophy and can be used in any given timeframe.
