Forex News and Market Analysis
Monday, August 3, 2026
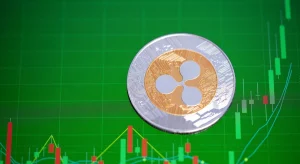
On Monday, XRP was trading at approximately $1.07 after Ripple’s monthly escrow release as instituti ...
5 hours

Gold (XAU/USD) is trading close to $4,064 ahead of the U.S. ISM Manufacturing PMI, the first signifi ...
5 hours

XRP is currently consolidated around the $1.00 psychological threshold, bal ...
6 hours

XAG/USD is trading around $59 per ounce, stabilizing following a volatile c ...
6 hours

Gold futures are c ...
7 hours
Dow Futures ...
7 hours
Forex Signals August 3: Palantir, SpaceX, AMD, HSBC, Oklo, MUFG Earnings Preview for This Week
4 min read

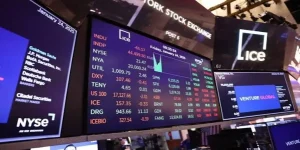
Investors are entering a busy earnings week, with Palantir Technologies, AMD, SpaceX, Caterpillar, H ...
13 hours
South African Rand: USD/ZAR Resumes Decline after Failing at R17 as Weaker USD and Lower Oil Support
4 min read
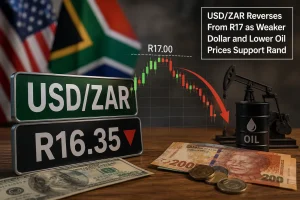
USD/ZAR has retreated from the psychologically important R17 level as a weaker U.S. dollar and easin ...
14 hours

Crude Oil prices opened sharp ...
14 hours
Dow Jones futures opened higher as easing geopolitical tensions and softer U.S. economic data suppor ...
14 hours
BTC Price Forecast: Bitcoin Enters August on Stronger Footing as ETF Buying Supports Recovery
3 min read

Bitcoin has entered the second half of 2026 on firmer footing, with ETF inflows, improving regulator ...
16 hours

Gold enters the week near the critical $4,000 level, with a weaker U.S. dollar offering some support ...
16 hours

SpaceX (NASDAQ: SPCX) is approaching one of its most critical weeks ...
19 hours

Quick Answer: Apple (NASDAQ: AAPL) lost more than 7% after the fiscal Q3 earnings p ...
20 hours

The arrival of a new trading week has employees at Microsoft (NASDAQ: MSFT) reflecting on one of the ...
23 hours

Intel (NASDAQ: INTC) has entered a sharp correction after rallying more than 700% from its 2025 low ...
1 day
Ripple Bullish forecast: XRP Joins Bitcoin, Ethereum with Crystal-Clear US Regulatory Green Light
1 min read
XRP is currently consolidating around the $1.00 psychological threshold, ba ...
1 day
Dow Jones Industrial Average E-mini Futures traded higher ...
1 day


...
2 days
When it comes to the markets, staying abreast of important economic events and breaking news
items is a full time job. Whether one is an active day trader or a long-term investor, the need to be current is one that must be satisfied every
single day. The FX Leaders news feed is a great way to stay on top of the evolving global
marketplace.
Everything You Need In An FX News Service
All Things Forex News, 24 Hours A Day, 5 Days A Week
Sidebar rates
