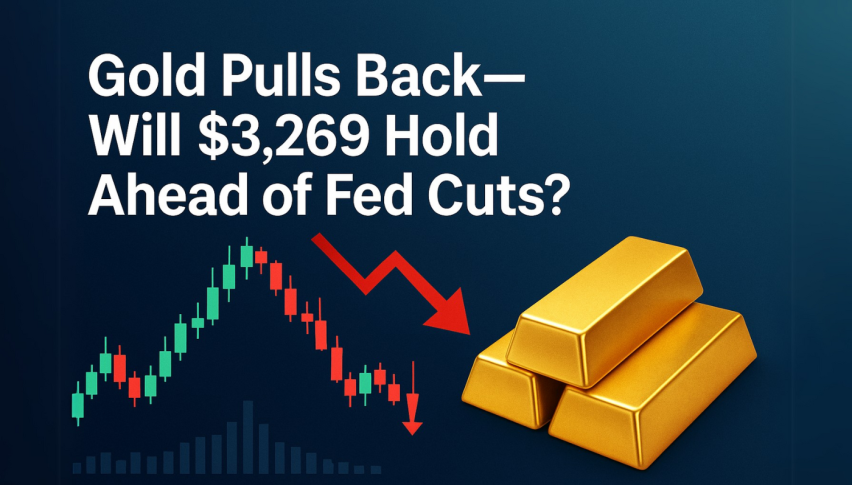
Gold Pulls Back—Will $3,269 Hold Ahead of Fed Cuts?
Gold prices slipped on Wednesday, retreating from recent highs as the U.S. dollar regained some ground and trade tensions eased.
Quick overview
- Gold prices fell as the U.S. dollar strengthened and trade tensions eased, retreating from a record high of $3,500.05.
- Investors are focused on upcoming U.S. PCE and jobs data, which could influence the Federal Reserve's interest rate decisions.
- Gold is currently at a critical technical juncture, with support at $3,269 and resistance around $3,320.
- Traders are advised to remain flexible, as gold's movement will depend on macroeconomic indicators and Fed expectations.
Gold prices slipped on Wednesday, retreating from recent highs as the U.S. dollar regained some ground and trade tensions eased. The U.S. Dollar Index (DXY) rose 0.1%, making gold more expensive for foreign buyers and applying pressure to bullion. This comes after a strong rally that took gold to a record high of $3,500.05 on April 22, driven by global macro uncertainty and tariff fears.
Now, a shift in sentiment is taking shape. U.S. President Donald Trump signed executive orders aimed at softening the blow of his auto tariffs, while negotiators announced a breakthrough with a foreign trade partner. Despite this, some analysts caution that confidence in U.S. assets remains shaky.
“Even if the administration is walking back some measures, the reputational hit to U.S. policy remains,” said Kyle Rodda, financial market analyst at Capital.com .
Eyes on Fed: PCE and Jobs Data in Focus
Investors are now turning their attention to U.S. Personal Consumption Expenditures (PCE) and Friday’s non-farm payrolls report. These data points could reshape expectations for the Federal Reserve’s next move on interest rates. Currently, traders are pricing in around 95 basis points in cuts by year-end.
Rodda added, “If the PCE data shows weaker inflation, that keeps the rate-cut door open. But a surprise upside could reduce the odds—and weigh on gold.”
The Fed’s policy path remains a major driver for gold, as lower rates tend to weaken the dollar and boost demand for non-yielding assets like bullion.
Chart Setup: Gold at Key Decision Point
From a technical standpoint, gold (XAU/USD) is forming a tight triangle pattern just above a rising trendline that started on April 23, with critical support at $3,269. Price is currently hovering around $3,308, below the 50-period EMA ($3,319).
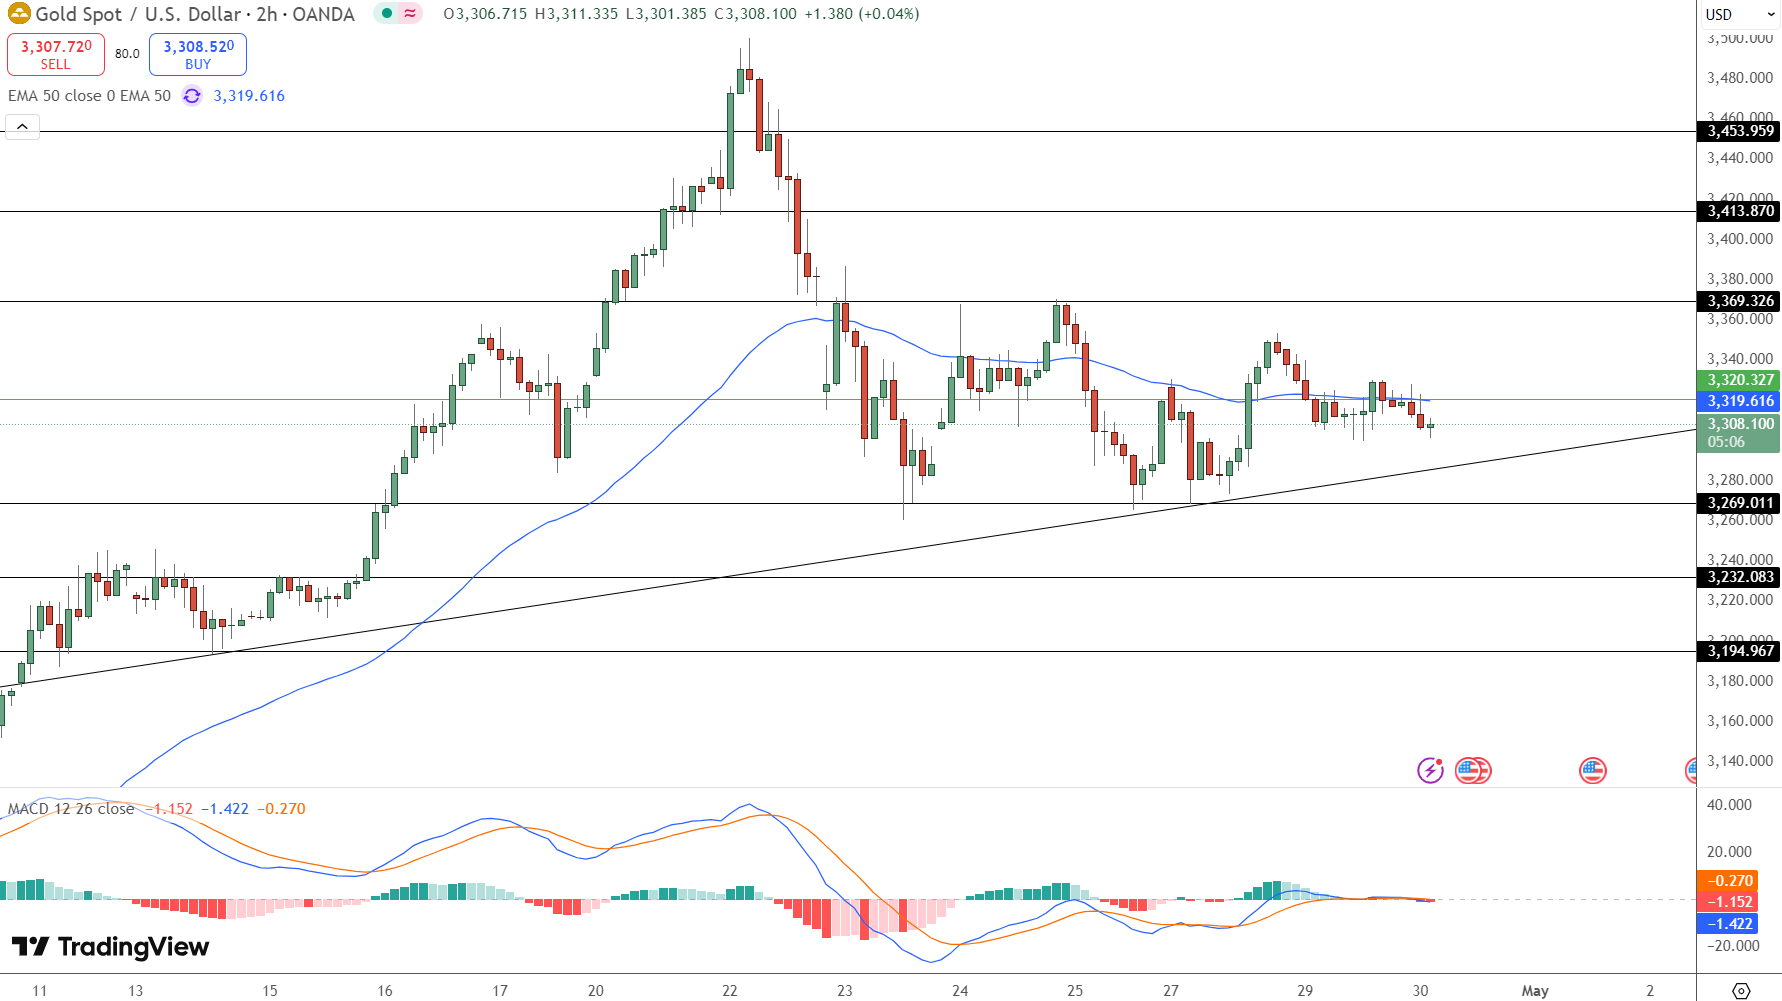
Momentum indicators, like the MACD, are neutral, signaling the market is in wait-and-see mode.
Trade Setup
Buy trigger: Break above $3,320 with volume
Stop-loss: Below $3,269
Target 1: $3,369
Target 2: $3,413
Why it matters: Holding above $3,269 would confirm buyers are defending trendline support. A clean breakout above the 50 EMA could revive bullish momentum. But a breakdown risks pushing gold toward $3,232 or lower.
Bottom Line:
Gold’s next big move hinges on macro data and Fed expectations. Until then, traders should stay nimble—letting the chart and economic signals lead the way.
- Check out our free forex signals
- Follow the top economic events on FX Leaders economic calendar
- Trade better, discover more Forex Trading Strategies
- Open a FREE Trading Account
Related Articles

Comments
Sidebar rates
Related Posts
