Ethereum’s ETH/BTC Ratio Hits 5-Year Low: Can ETH Stage a Comeback?
The ETH/BTC ratio has hit its lowest point in 5 years, and Ethereum is under pressure. While Bitcoin just hit $100,000, Ethereum is stuck...
Quick overview
- The ETH/BTC ratio has reached a five-year low as Ethereum struggles below $2,000 while Bitcoin recently hit $100,000.
- Increased competition from newer blockchains is impacting Ethereum's market position, contributing to its declining ratio against Bitcoin.
- Ethereum lacks a prominent backer like Bitcoin's Michael Saylor, making it more susceptible to weaker buying momentum in the current macro environment.
- Despite challenges, Ethereum shows signs of a potential short-term rebound, with critical support levels indicating buyer interest.
The ETH/BTC ratio has hit its lowest point in 5 years, and Ethereum is under pressure. While Bitcoin just hit $100,000, Ethereum is stuck below $2,000 and even dropped to $1,400 at its worst. This divergence has pulled the ETH/BTC ratio down.
A big part of the problem is competition. Newer blockchains with faster speeds and lower fees are eating into Ethereum’s smart contract space. Without an edge in efficiency or cost, Ethereum is finding it harder to hold its leadership position—adding to the ETH/BTC decline.
Ethereum’s Buyer Gap and Changing Macro Climate
One key difference between Bitcoin and Ethereum is the lack of a heavyweight backer. Bitcoin has had consistent backers like Michael Saylor who boosted BTC’s legitimacy and demand. Ethereum has no such figurehead, making it more vulnerable to weaker buying momentum.
Adding to the challenge, the global macro environment now favors Bitcoin over Ethereum. Bitcoin and gold are seen as “wartime assets”—a hedge against uncertainty—while Ethereum is viewed as a “peacetime asset” for calmer markets. With global tensions high, investors are naturally going to Bitcoin and gold and sidelining ETH for now.
Ethereum Technical Setup: Short Term Rebound
Despite all this, Ethereum is showing some technical signs. ETH/USD is at $1,811 after bouncing off critical support at $1,783 and reclaiming its 50-period EMA on the 2-hour chart. This trendline defense means buyers are stepping in at support and looking to push prices higher.
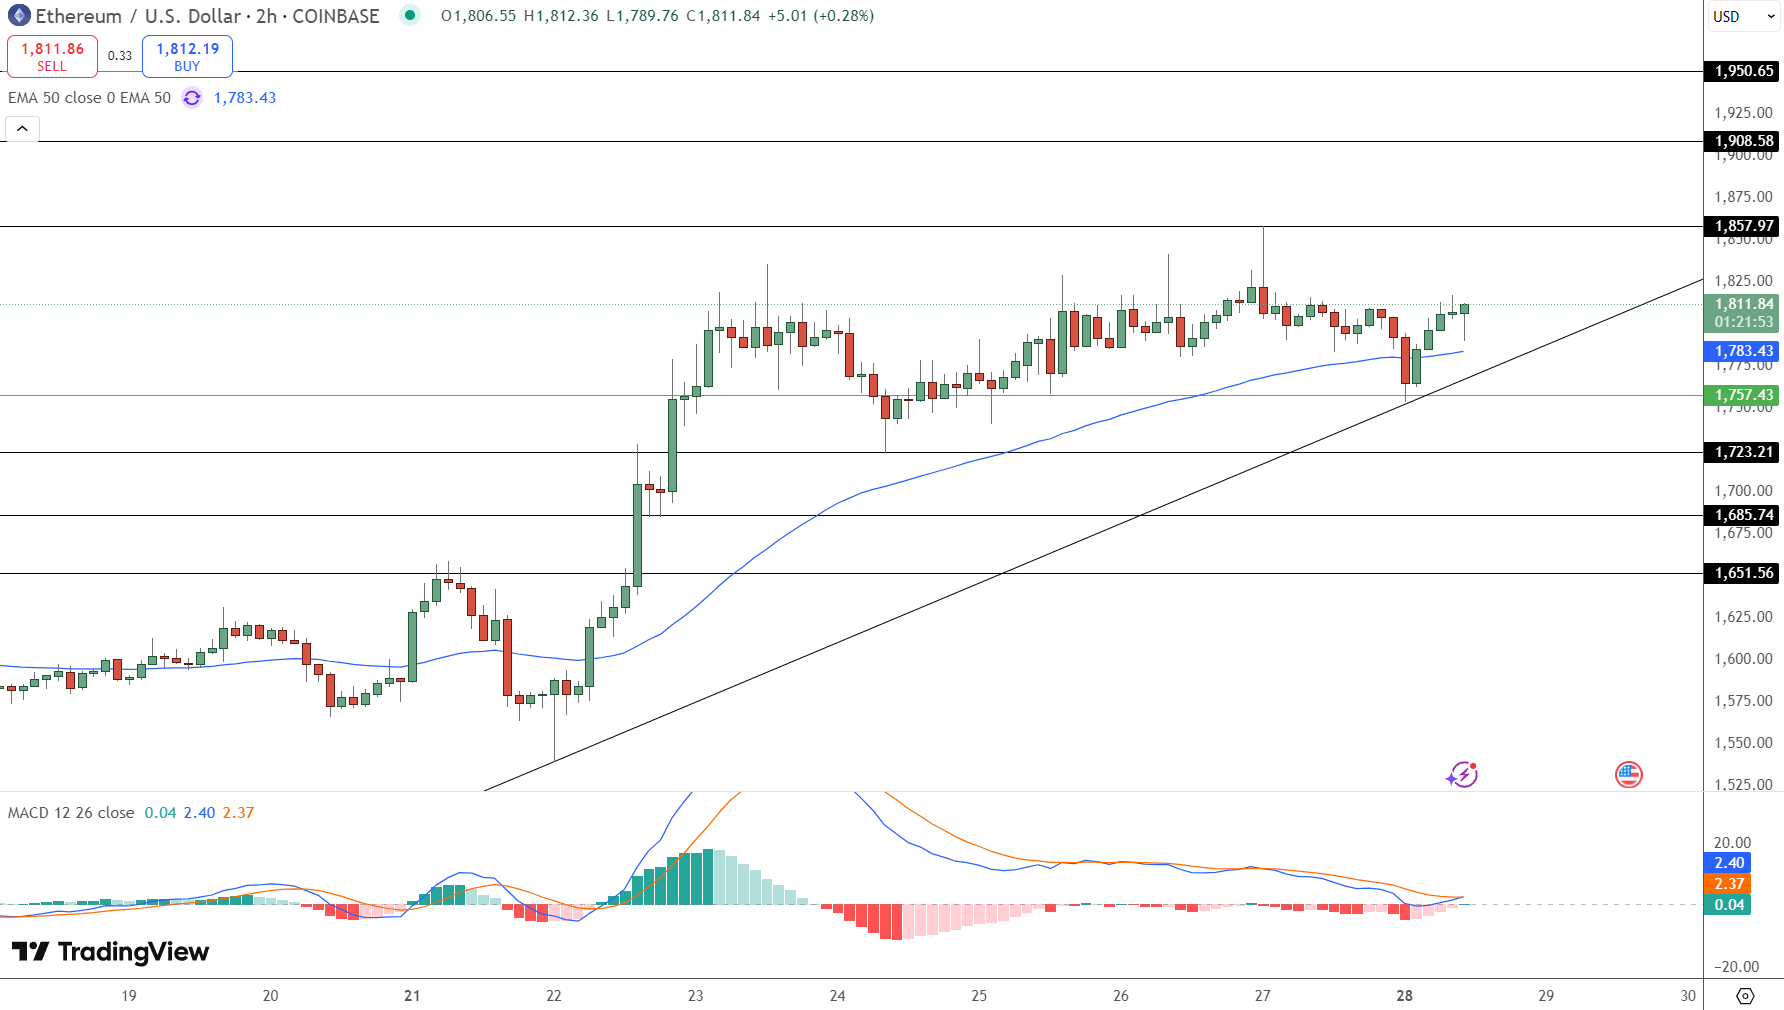
For newbies, this is called a trendline defense—where buyers step in at rising support to push prices higher.
Trade Setup to Watch:
Buy Breakout: Above $1,857
Upside Targets: $1,908 and $1,950
Support to Watch: $1,783 and $1,757
Stop-Loss: Below $1,757
Be patient—wait for a clean breakout above $1,857 before entering, as consolidation around resistance often causes fakeouts.
- Check out our free forex signals
- Follow the top economic events on FX Leaders economic calendar
- Trade better, discover more Forex Trading Strategies
- Open a FREE Trading Account
Related Articles

Comments
Sidebar rates
Related Posts
