WTI Crude Oil (USOIL) Eyes $64.54—Tariffs, Iran, and OPEC+ Shake the Chart
WTI crude is flat at $62.34 after falling 2% yesterday. OPEC+ and mixed trade headlines out of Washington are at the center...
Quick overview
- WTI crude is currently flat at $62.34 after a 2% drop yesterday, influenced by OPEC+ dynamics and trade news.
- Several OPEC+ countries are advocating for increased oil output in June, while Kazakhstan refuses to cut production due to national priorities.
- Mixed trade headlines from Washington suggest potential tariff reductions on Chinese goods, but no immediate changes are planned.
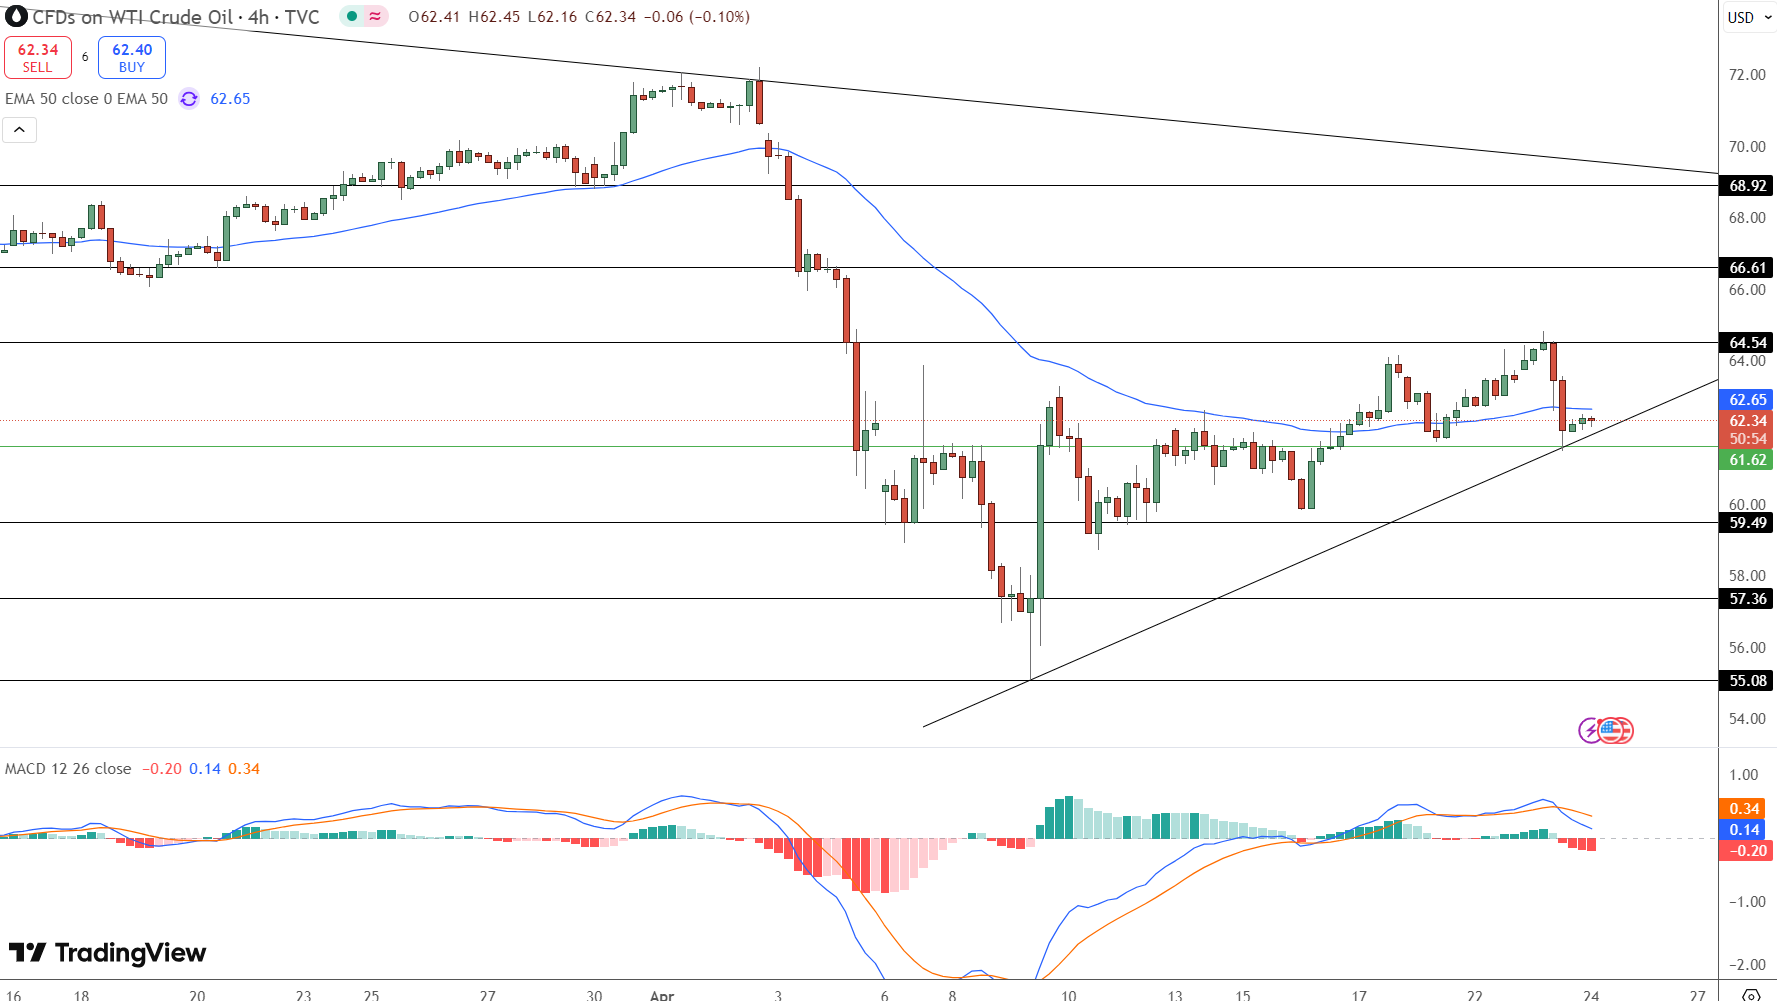
- Technically, WTI is stabilizing with support at $61.62 and resistance at $64.54, indicating a potential rebound.
WTI crude is flat at $62.34 after falling 2% yesterday. OPEC+ and mixed trade headlines out of Washington are at the center of the volatility.
Several OPEC+ countries are reportedly pushing for a second month of increased oil output in June—more pressure on prices. And Kazakhstan said it can’t cut production at major oil fields, citing national priorities over group commitments.
The oil market is at a crossroads with growing supply and uncertain demand.
Key points:
WTI at $62.34 after bouncing from $61.62
OPEC+ members want more output in June
Kazakhstan won’t cut key field production
Trade War Headlines Add Fuel to the Fire
While supply news shook the supply side, demand headlines were mixed. Reports out of Washington say the White House is considering a 50% reduction in tariffs on Chinese goods—a move to revive US-China trade talks.
US Treasury Secretary Scott Bessent said current tariffs are unsustainable and adjustments may be needed. But White House Press Secretary Karoline Leavitt quickly clarified no unilateral moves are planned, ahead of talks.
Meanwhile US-Iran nuclear talks are showing strain. New US sanctions on Iran’s energy sector may block any breakthrough, delaying the return of Iranian barrels to the market.
Oil Price Setup: Bounce in Progress?
Technically WTI is stabilizing. Price bounced from $61.62 support which is a rising trendline and 50-period EMA.
MACD is still bearish but if price holds above $61.62 and prints a bullish candle, momentum could turn. Look for $64.54 as next resistance. Break above that and $66.61 is next.
Trade Setup:
Buy Entry: On bullish confirmation from $61.62
Target: $64.54
Stop Loss: Below $59.49
Quick Technicals:
Current Price: $62.34
Support: $61.62
Resistance: $64.54
Trend: Rebound
Momentum: Stabilizing after selloff
In summary: WTI oil is a geopolitical mess and technical bounce. OPEC+, US-China and Iran sanctions all in play, wait for confirmation of the bounce.
- Check out our free forex signals
- Follow the top economic events on FX Leaders economic calendar
- Trade better, discover more Forex Trading Strategies
- Open a FREE Trading Account
Related Articles

Comments
Sidebar rates
Related Posts
