Ethereum Eyes Critical $1,800 Resistance Amid Rising ETF Inflows and Technical Breakout
Ethereum (ETH) is trading above the $1,700 level, experiencing a slight dip of over 1.3% in the past 24 hours. Despite this minor pullback
Quick overview
- Ethereum (ETH) is currently trading above $1,700, experiencing a slight dip of over 1.3% in the last 24 hours but showing signs of potential recovery.
- US spot Ethereum ETFs recorded their highest net inflows since February, totaling $38.8 million, indicating a shift in institutional interest.
- Technical indicators suggest that ETH is testing resistance levels and may aim for significant price targets if it breaks above the current declining channel.
- The upcoming Pectra upgrade on May 7 is expected to enhance Ethereum's network efficiency and could further support its price action.
Ethereum (ETH) is trading above the $1,700 level, experiencing a slight dip of over 1.3% in the past 24 hours. Despite this minor pullback, ETH/USD is showing signs of potential recovery, fueled by a notable increase in US spot ETH ETF inflows and technical indicators suggesting a possible reversal against both the US dollar and Bitcoin BTC/USD.

Spot Ethereum ETFs Record Highest Net Inflows Since February
With a total of $38.8 million entering US spot Ethereum ETFs on Wednesday, these investment vehicles have recorded their highest inflows in a noteworthy market development since February 4. This represents the first net inflow since April 4, so indicating a change in institutional attitude.
Leading the charge were Fidelity’s FESH and Bitwise’s ETHW, respectively adding $32.7 million and $6.1 million to the total inflow figure. For Ethereum, whose market leadership has lately dropped below 7%, this flood of institutional money comes at a pivotal point.
After ETH ETFs had almost reached $1 billion in cumulative outflows since February 20, the fresh institutional interest shows a possible turning point. Should this encouraging trend hold, Ethereum’s price may get significant support in the next weeks.
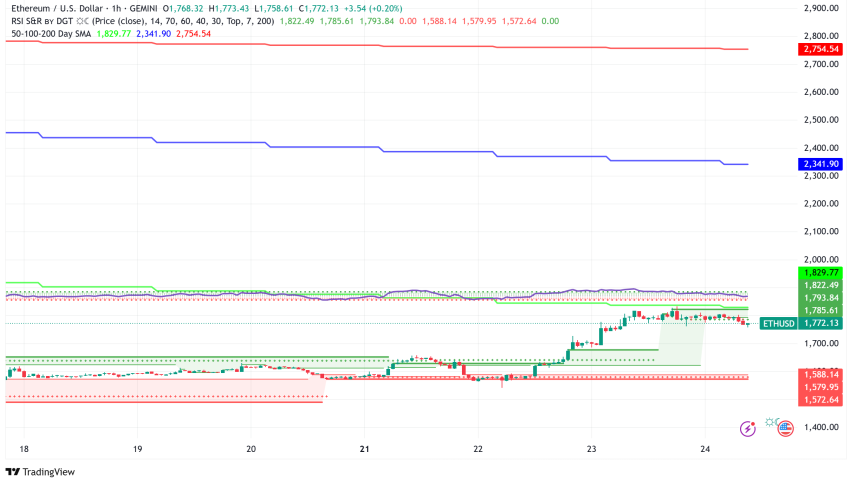
ETH/USD Technical Analysis: ETH Confronts Descending Channel Resistance
Technically, Ethereum is now testing notable levels of resistance following a rejection at its 50-day Simple Moving Average (SMA.). Since December 16, the bitcoin has been trading in a declining channel pattern; bulls now see a breakthrough above the upper limit of the channel.
Remarkably above its neutral level, the Relative Strength Index (RSI) points to further optimistic momentum. The Awesome Oscillator shows declining green bars below its neutral level at the same time, suggesting that a cross above would enhance the bullish argument even more.
Still, the Stochastic Oscillator has ventured overbought area, suggesting a possible temporary pullback.
ETH must, on the negative side, keep support at $1,688 if it is to keep its positive projection. Ethereum might be driven toward the psychologically important $2,000 level by a clear break over the top border of the declining channel.
ETH/BTC Pair Shows Signs of Bottoming
Ethereum has rebounced 10.42% from record lows vs Bitcoin, showing a positive daily chart divergence. Having reached as low as 0.0175 BTC, the ETH/BTC pair is presently trading at 0.019 BTC.
Technical indicators show that ETH/BTC may be reaching a bottoming phase, with the daily Relative Strength Index establishing higher lows while prices continue to set lower lows—a typical bullish divergence pattern. The last time such a scenario existed was in November 2024, prompting a 24% bounce in the pair.
On the 2-hour chart, ETH/BTC has broken out of a descending triangle pattern with increased volume, signaling a probable short-term bullish reversal. Now challenging its 200-period EMA at 0.01935, the pair has an upward objective near 0.02051 based on the height of the triangle, thereby indicating a possible 7% gain from present levels.
ETH Market Dynamics: Exchange Flows and Liquidations
On-chain data shows that spot investors might be booking gains from the recent price rise despite the positive institutional inflows. Coinglass data shows that exchange net inflows have increased above $150 million during the past two days.
The market has also seen notable liquidations; $81.82 million in ETH futures holdings sold during the past 24 hours. Of this overall, $30.72 million were long positions and $51.11 million came from shorts, suggesting erratic trading conditions.
Can Upcoming Pectra Upgrade Drive Further Bullish Momentum?
Apart from the basic case for Ethereum, the network is getting ready for its Pectra upgrade set for May 7. Several improvements to the Ethereum mainnet will be presented with this important release, including:
- Wallet recovery options
- Transaction batching capabilities
- Expansion of Blobspace
- Staking limit raised to 2,048 ETH
These technical developments might increase network efficiency and draw more Ethereum ecosystem users, so supporting ETH’s price action.
Ethereum Price Prediction: Potential for $4,000+ by End of 2025
Looking ahead, several analysts continue to have a somewhat optimistic long-term view on Ethereum. Technical study from TradingView indicates that, on the 3-day period, Ethereum might be nearing a strong support level around $1,629, which has caused notable positive reversals.
Should this support be strong, ETH may aim for multiple important levels on its route to a new all-time high:
First target: $2,506 (aligned with a March bearish order block)
Second target: $3,708 (around the January fair value gap)
Ultimate goal: By 2025’s end, beyond $4,500
Ethereum is currently in consolidation phase; it shows instantaneous resistance at $1,820 and support at $1,740. The capacity of the Bitcoin to remove the $1,840 resistance level will define whether it keeps on its increasing path or enters another phase of corrections.
- Check out our free forex signals
- Follow the top economic events on FX Leaders economic calendar
- Trade better, discover more Forex Trading Strategies
- Open a FREE Trading Account
Related Articles
Comments
Sidebar rates
Related Posts
