AMZN Rebounds: Bull Trend Resuming for Amazon Stock?
Following weeks of declining activity, Amazon (AMZN) once again displayed signs of life, beginning with a bullish gap as technical support h

Quick overview
- Amazon (AMZN) showed signs of recovery after weeks of decline, opening with a bullish gap as broader markets improved on trade sentiment.
- Optimistic comments from U.S. officials regarding trade negotiations with China boosted market confidence and risk appetite.
- The 100-week simple moving average has provided reliable support for Amazon, suggesting a potential trend reversal as the stock attempts to stabilize.
- Both Amazon and Walmart are positioned to thrive in the evolving e-commerce landscape, with Amazon focusing on non-grocery categories and logistics.
Live AMZN Chart
[[AMZN-graph]]
Following weeks of declining activity, Amazon (AMZN) once again displayed signs of life, beginning with a bullish gap as technical support held strong and broader markets climbed on improving trade confidence.
From Trade Anxiety to Market Optimism
Markets opened the week on shaky ground amid deepening U.S.-China trade tensions, sparking renewed fears among investors and contributing to a bearish tone across equities. However, sentiment shifted sharply following optimistic commentary from U.S. officials regarding trade negotiations. Treasury Secretary Bessent, speaking at a JPMorgan private investor event, reportedly expressed confidence in an imminent de-escalation with China.
He also confirmed that the U.S. is actively pursuing new trade deals with key allies including Australia, Japan, South Korea, and India. These developments bolstered risk appetite, propelling both the U.S. dollar and equity markets higher.
AMZN Bounces Back: Technicals Show Support Holding
Amazon’s stock has been under pressure since early February, sliding from the record high above $242. Yet in recent weeks, the stock has been attempting to stabilize and reverse course. Two weeks ago, fears of a potential “Black Monday” triggered a steep drop in equity futures, dragging AMZN down with them.
But a dramatic intraday reversal midweek sparked one of the most aggressive rebounds in recent memory, sending Amazon shares surging nearly 20% to $192. Still, resistance at the 50-week simple moving average (SMA) capped the rally, and the stock failed to breach the $200 level.
Amazon Chart Weekly – The 100 SMA Held as Support
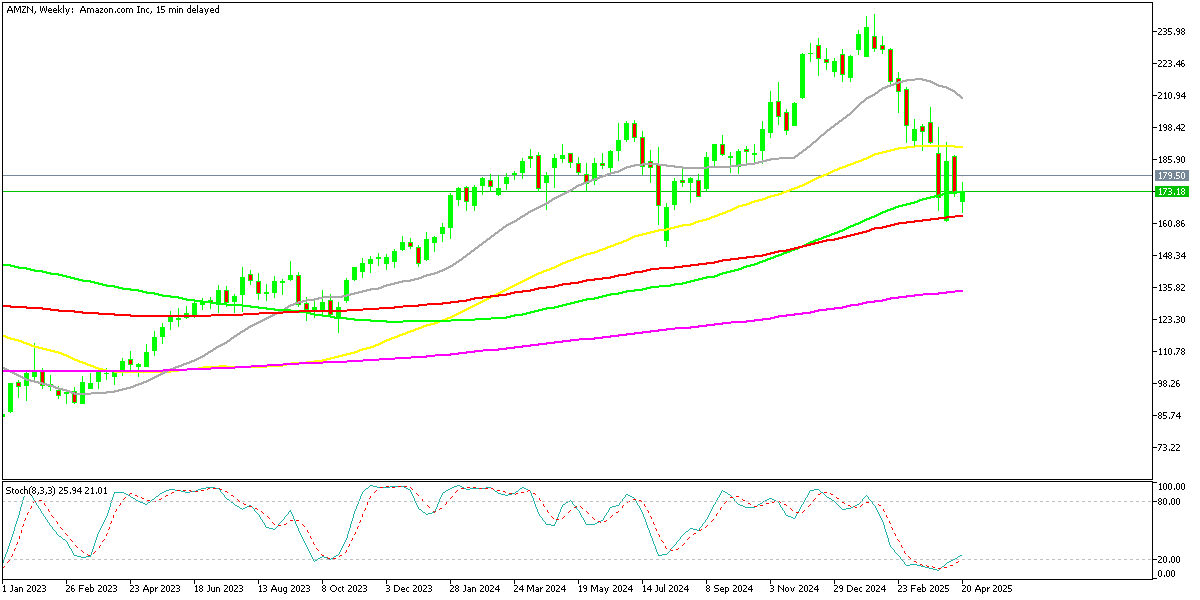
However, the 100-week SMA has proven to be a reliable support zone, preventing further downside and creating the foundation for a renewed bounce. Amazon closed the U.S. session yesterday at $173.18, up 3.5% on the day, and continued to climb in after-hours trading, rising past $179.
Momentum Building for a Potential Trend Reversal
The renewed buying interest around the 100-week SMA, paired with improving macro sentiment, suggests that Amazon may be carving out a bottom. If the latest bounce holds, the decline from February could mark a completed corrective phase, paving the way for the resumption of the longer-term bullish trend. A move back toward $200 will be the first major test of this emerging recovery.
E-Commerce Outlook: Amazon and Walmart Lead the Way
In the broader e-commerce space, Amazon and Walmart remain top contenders with structural advantages. Amazon is well-positioned to maintain dominance in non-grocery categories, while its focus on automation and logistics may drive future margin expansion. Walmart, meanwhile, is carving out a strong lead in online grocery, employing similar strategies to boost profitability in its digital channels. As the retail landscape continues to evolve, both companies are expected to thrive over the long term.
Conclusion: Signs of Strength, But Resistance Awaits
Amazon’s recent rebound, backed by technical support and a brighter macro outlook, has rekindled hopes that the stock is ready to rejoin the broader market rally. While the $200 level looms as the next key hurdle, the resilience shown around long-term support levels suggests that the worst of the recent pullback may be behind us. Investors will now be watching for follow-through momentum and confirmation that Amazon’s larger uptrend is indeed resuming.
- Check out our free forex signals
- Follow the top economic events on FX Leaders economic calendar
- Trade better, discover more Forex Trading Strategies
- Open a FREE Trading Account
Related Articles
Comments
Sidebar rates
