WTI Crude Climbs to $62.80—Eyes $65.70 Amid Tariff Turmoil
WTI crude has bounced back to $62.80 per barrel after last week’s low of $57.12—the lowest price in over four years.
Quick overview
- WTI crude has rebounded to $62.80 per barrel after hitting a four-year low of $57.12 due to trade war concerns.
- The recovery is attributed to short-covering and optimism surrounding US-Iran nuclear talks, despite ongoing market caution.
- Technical indicators show bullish signs, with key resistance levels at $63.65 and $65.70, while support is near $61.66 and $60.00.
- Traders are advised to wait for confirmation before entering positions, as geopolitical risks and supply developments continue to influence the market.
WTI crude has bounced back to $62.80 per barrel after last week’s low of $57.12—the lowest price in over four years.

The earlier drop was due to global markets reacting to fresh trade war concerns after the US imposed a 104% tariff on Chinese imports. The move led to fears of an economic slowdown and reduced energy demand, which hit oil prices hard.
But after days of selling, crude is recovering. Traders are pointing to short-covering and renewed optimism over US-Iran nuclear talks which if productive could ease tensions and reduce pressure on global supply chains.
But this bounce hasn’t erased market caution. With OPEC+ increasing output in May and geopolitical risks still looming, oil’s path higher is bumpy.
WTI Technical Outlook: Bullish Signs, But Caution Warranted
From a charting perspective WTI is showing early signs of recovery. Price has moved above the 50-period Exponential Moving Average (EMA) at $62.25—a level watched by traders for short-term trend signals. The Relative Strength Index (RSI) is at 50.9, a balanced but watchful market.
Resistance levels to watch are $63.65 and $65.70 which are the 50% and 61.8% Fibonacci retracement levels from the recent selloff. A move through these levels would suggest buyers are in control.
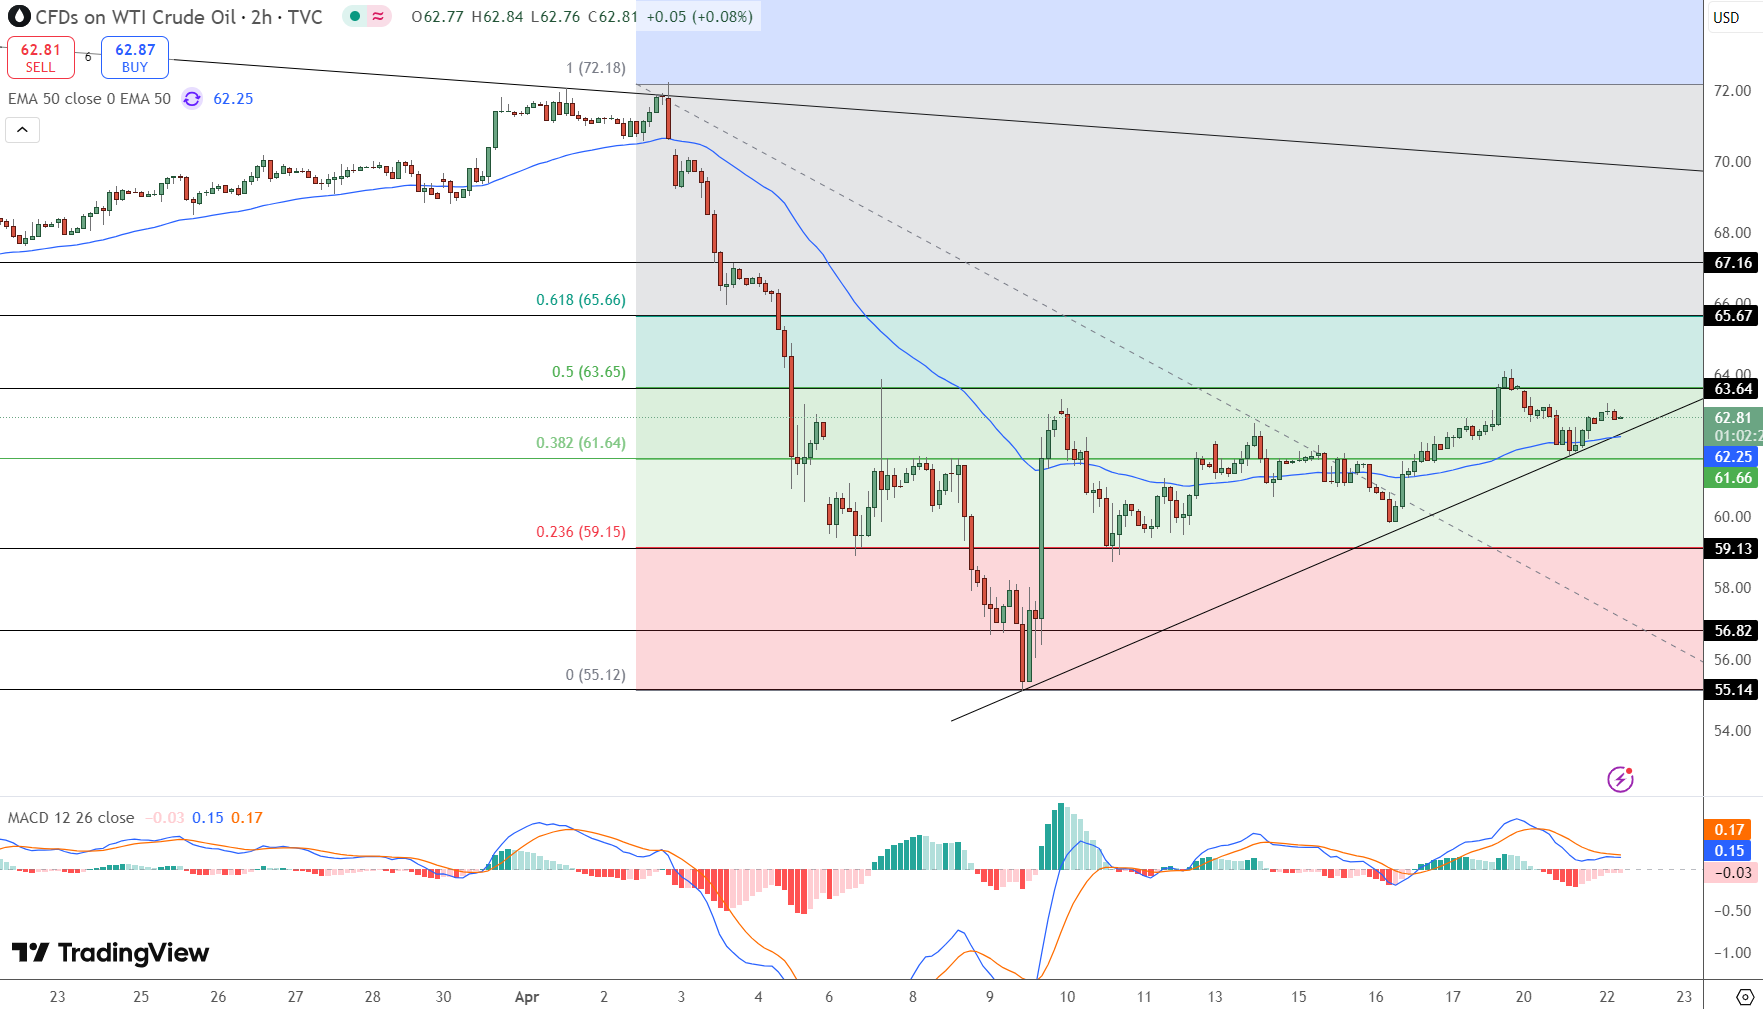
On the flip side support is near $61.66 and $60.00. A break below $60 would likely trigger bearish momentum.
Trade Plan
If you’re new to oil trading this setup offers a relatively clean risk-reward:
Entry Zone: Buy near $61.66-$62.25 if bullish confirmation (strong green candle or volume spike) appears
Targets: $63.65 (initial), $65.70 (extended)
Stop Loss: Below $61.00 to protect against further selling
The key here is patience. Don’t chase the bounce—wait for price and volume to confirm the move. With tariff news and supply developments moving the needle daily, stay alert is just as important as getting your entry right.
Bottom Line
Oil is bouncing after the sell off but this is more than just a bounce—it’s a turning point. If tensions ease and supply is in check WTI could go to $65 and higher.
- Check out our free forex signals
- Follow the top economic events on FX Leaders economic calendar
- Trade better, discover more Forex Trading Strategies
- Open a FREE Trading Account
Related Articles


Comments
Sidebar rates
Related Posts
