Gold Climbs on Risk Fears—$3,380 and Rising?
Gold prices went parabolic this week, hitting an all-time high of $3,384 as a storm of geopolitical and economic risks sent investors...
Quick overview
- Gold prices surged to an all-time high of $3,384 due to escalating geopolitical and economic risks.
- The US Dollar Index has reached a 3-year low, making gold more appealing to international investors.
- Technical analysis indicates that gold is at a critical decision point, with potential targets for both bullish and bearish scenarios.
- Despite strong momentum, caution is advised as overbought signals may lead to profit-taking or consolidation.
Gold prices went parabolic this week, hitting an all-time high of $3,384 as a storm of geopolitical and economic risks sent investors into safe-haven assets.

The breakout comes as US-China trade tensions escalate, the US dollar plunges and global stability concerns grow.
The US Dollar Index (DXY) has hit a 3-year low, making gold more attractive to holders of other currencies. Meanwhile, ceasefire violations in Ukraine and fresh tariff threats have heightened fears of a global slowdown.
“Geopolitical risks, stagflation concerns and central bank buying are all working in gold’s favour now,” said market strategist Yeap Jun Rong.
Gold (XAU/USD) Technical Analysis: Can Gold Go Higher?
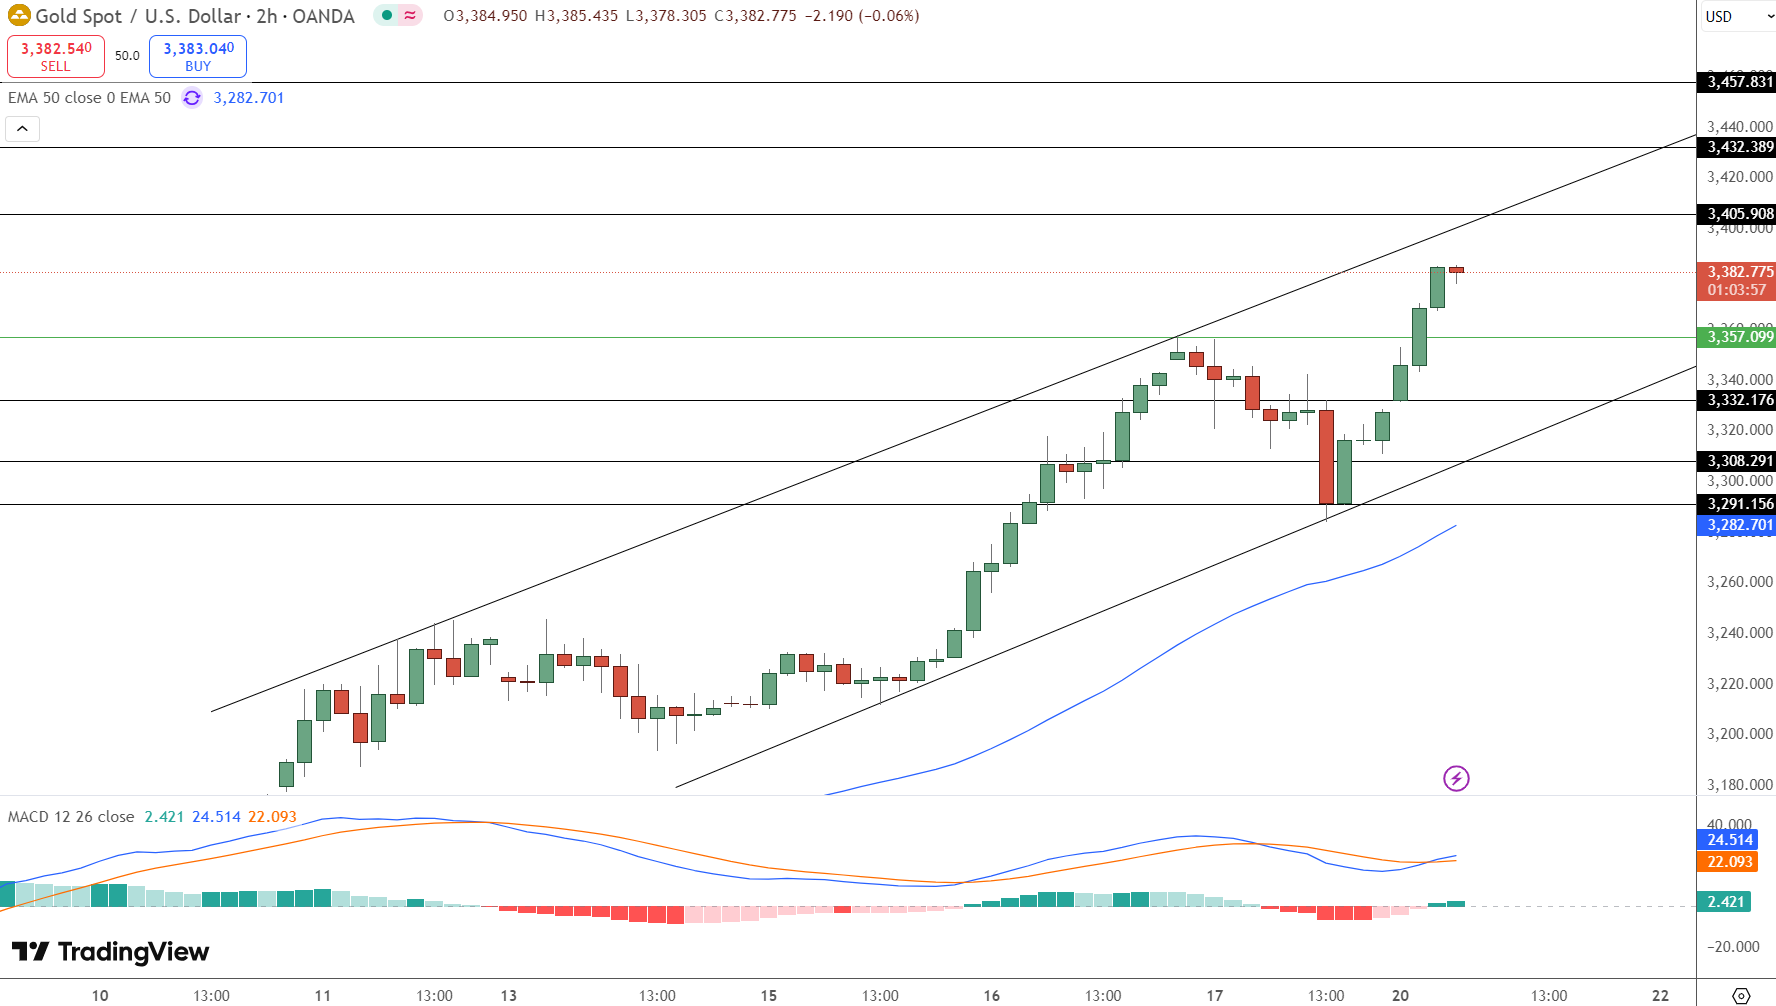
Technically, gold (XAU/USD) is testing the top of its rising channel, now trading just below $3,384 after rebounding from $3,308 support. A recent MACD bullish crossover and rising histogram bars suggest momentum is still with the bulls.
But price is at a decision point. A breakout above $3,405 could take it to $3,432, then $3,457. Failure to break resistance may see a pullback to $3,357 or even $3,332 if selling accelerates.
Trade Setup:
Bullish Scenario: Buy on breakout above $3,405
Target: $3,432 → $3,457
Stop Loss: Below $3,357
Bearish Scenario: Sell on breakdown below $3,357
Target: $3,332
Stop Loss: Above $3,405
Pro Tip: Wait for a confirmed breakout or breakdown. A strong candle close with above average volume is your signal.
Outlook: Momentum is Strong But So is Caution
Gold’s surge is supported by fundamentals but near-term overbought signals are emerging. That means some profit taking or consolidation could happen – especially if global headlines calm down or the dollar tries to rebound.
Still, the bigger picture is bullish. Goldman Sachs and UBS have recently raised their forecasts, with Goldman now at $3,950 and warning of $4,500 if recession risks escalate.
Conclusion:
Gold has gone parabolic—but it’s not just noise. Keep an eye on the levels and the headlines. Whether you’re trading or investing, this is not just a blip.
- Check out our free forex signals
- Follow the top economic events on FX Leaders economic calendar
- Trade better, discover more Forex Trading Strategies
- Open a FREE Trading Account
Related Articles


Comments
Sidebar rates
Related Posts
