Bitcoin Holds Firm Above $84K Amidst Uncertainty, Analysts Eye $86K Break for Reversal
Bitcoin is currently trading around $84,000, maintaining relative stability over the past 24 hours as market participants analyze mixed
Quick overview
- Bitcoin is trading around $84,000, showing stability as analysts debate its future direction after bouncing from local lows of $75,000.
- Demand indicators suggest early recovery signs, but trade volumes remain significantly lower than previous bull market levels.
- US-China trade tensions are impacting Bitcoin mining, with companies selling over 40% of their mined BTC due to financial pressures.
- Analysts highlight a critical resistance zone at $86,300-$86,500 that Bitcoin must surpass to restore bullish sentiment.
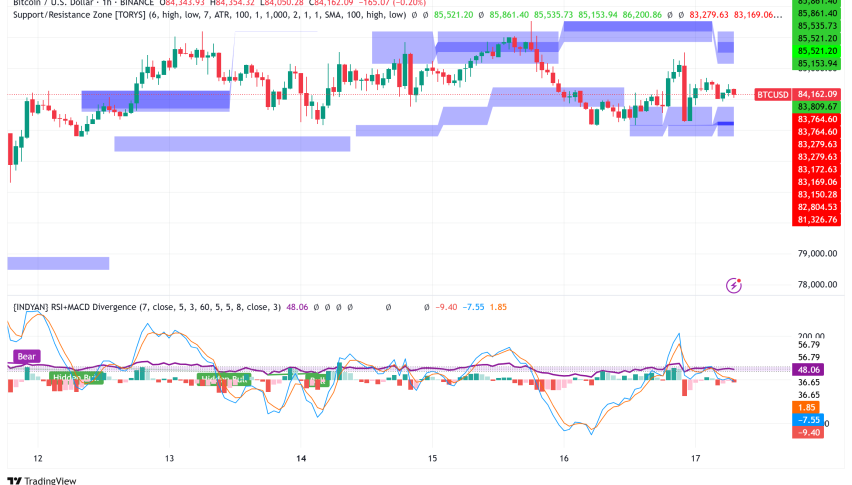
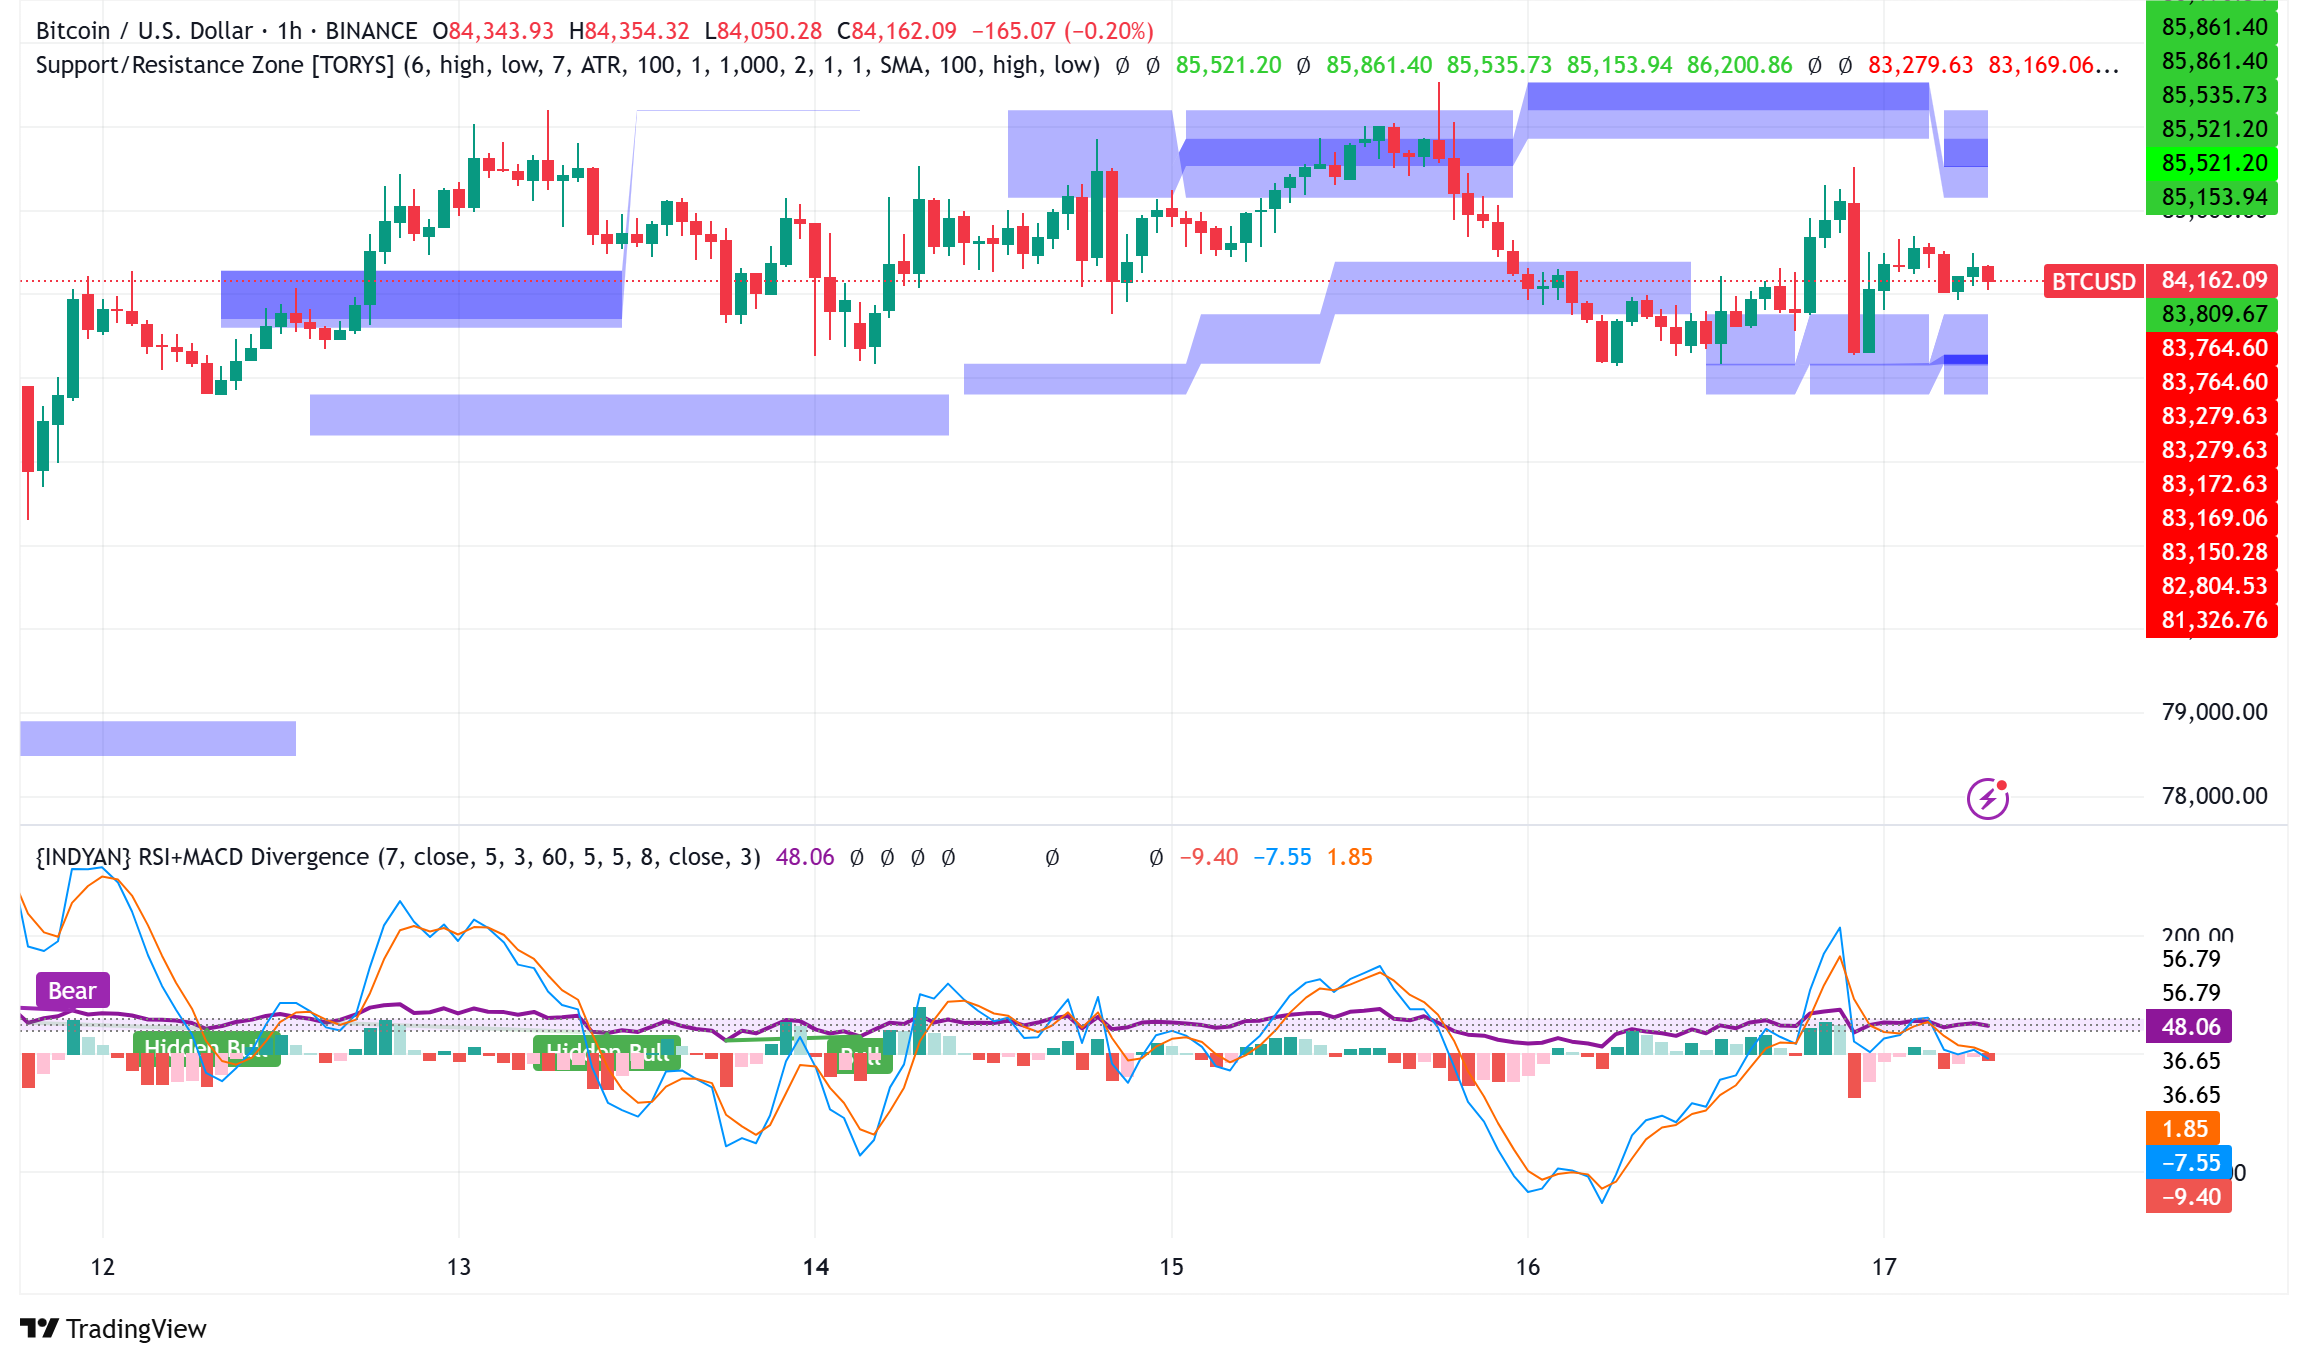
Live BTC/USD Chart

Bitcoin is currently trading around $84,000, maintaining relative stability over the past 24 hours as market participants analyze conflicting signals about its future direction. Following a significant bounce from local bottoms near $75,000 in early April, analysts remain divided on whether BTC/USD is establishing a genuine trend reversal or merely experiencing temporary relief.
Supply and Demand Dynamics Show Early Recovery Signs
After a protracted time in negative territory, the apparent demand of the cryptocurrency—calculated by the 30-day net difference between exchange inflows and outflows—is starting to show first signals of recovery. This increase, meanwhile, might just be a stop in selling pressure rather than a clear bottom indicator.
With spot Bitcoin trading around 30,000 BTC daily and derivatives at about 400,000 BTC, daily trade volumes nevertheless remain far lower than past bull market levels, according to CryptoQuant. These numbers just scratch the quantities observed in the June-July 2021 period before the previous significant bull run.
From the supply side, liquidity situations are still tight. The realized cap increase has slowed to 0.80% monthly, below usual bull market levels, suggesting ongoing absence of significant new capital into the Bitcoin network. The lowest level since November 2018, exchange balances have decreased to just 2.6 million BTC, therefore further restricting available sell-side liquidity.
US-China Trade Tensions Impact BTC Mining Sector
March was the biggest monthly liquidation since October 2024 as Bitcoin mining companies sold over 40% of their jointly produced BTC. This marks a reversal of the post-halving pattern of accumulation and implies mounting financial pressure in macroeconomic instability.
As the industry deals with several difficulties, including possible tariff effects from rising US-China trade tensions, mining companies’ growing selling activity comes as natural. Experts in the sector caution that Donald Trump’s projected energy import levies and current 24% tariffs on mining components could make Bitcoin mining in the US commercially unviable.
“Importing machines to the US will now cost at least 24% more compared to tariff-free countries like Finland,” said Hashlabs CEO Jaran Mellerud, who foresaw US mining companies progressively losing market share as a result.
Dollar Weakness Could Provide Tailwinds
Some analysts see a possible catalyst in the dropping value of the US dollar notwithstanding present market hesitation. Failing to recover the psychologically important 100 threshold, the Dollar Index (DXY) is lingering close to multi-year lows.
“DXY is dropping at its fastest pace since 2023,” trader BitBull said, equating this with early 2023 when Bitcoin came out of the bear market and soared over 200% in one year.
According to Goldman Sachs research, the US dollar stays “significantly overvalued,” so there may be space for more dollar devaluation that would help the value of Bitcoin.
BTC/USD Technical Analysis: Critical Resistance Zone at $86,300-$86,500
To validate a positive turnaround, technical experts have found a critical resistance zone between $86,300 and $86,500 that Bitcoin must pass. While Alphractal’s Alpha Price Chart—which combines realized cap, average cap, and onchain sentiment—reinforces the relevance of the $86,300 threshold—CoinGlass’s liquidity heat map shows dense clusters of sell orders at these levels.
“BTC must clearly break above $86,300 to restore short-term bullish sentiment,” says Alphractal’s study. “Support levels lay at $73,900 and $64,700 should the price weaken once more.”
Bitcoin’s Institutional Investment Trends
Additionally reflecting the uncertain environment of today is institutional investment flow. Spot Bitcoin ETFs have had ongoing withdrawals of approximately $870 million from April 3; the first little inflow does not show until April 15. Notwithstanding these outflows, trade volumes remain rather strong—only 18% below the 30-day average—indicating some ongoing institutional desire.
Although long-term holders would show great support based on Bitcoin’s endurance over $80,000, a significant trend reversal would depend on more trading volumes and liquidity to maintain momentum. All eyes are still on whether Bitcoin can effectively attack the crucial $86,300 barrier level in the next weeks as the market seeks more certain direction.
- Check out our free forex signals
- Follow the top economic events on FX Leaders economic calendar
- Trade better, discover more Forex Trading Strategies
- Open a FREE Trading Account
Related Articles


Comments
Sidebar rates
Related Posts
