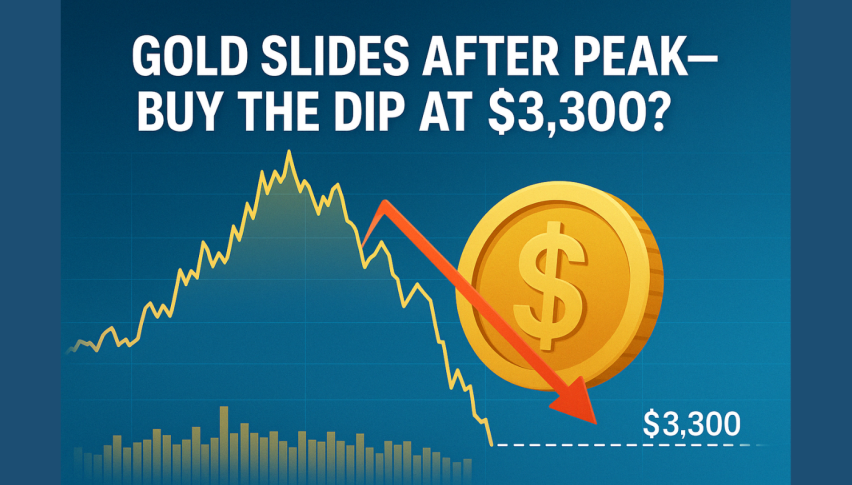
Gold has staged an extraordinary comeback after rebounding off its 50-week simple moving average in early April. Prices surged by $260 over three sessions, marking the largest three-day rally in the precious metal’s history. This rally was driven by renewed demand for safe-haven assets amid escalating trade tensions between the U.S. and China. A sharp depreciation in the U.S. dollar further amplified gold’s gains.
btc-usd
Forex Signals April 16: Have Tariffs Impacted March US Retail Sales?
Today we have the US retail sales and Bank of Canada meeting, which might offer some reprieve for markets besides the tariff talk.
Skerdian Meta•Wednesday, April 16, 2025•3 min read

Live BTC/USD Chart
BTC/USD
MARKETS TREND
Today we have the US retail sales and Bank of Canada meeting, which might offer some reprieve for markets besides the tariff talk.

Today’s Upcoming Forex Events
The Bank of Canada’s upcoming monetary policy decision is drawing significant attention in financial markets today. While inflation in the UK is expected to show only a slight decline—falling from 2.8% to 2.7% year over year, likely due to lower gasoline prices—services inflation remains persistently high, which could limit any relief from headline figures.
Across the Atlantic, the United States is also in focus, particularly with retail sales data on the docket. Forecasts suggest that core retail sales may rise by 0.4% month over month, up from the previous 0.3%, while overall retail sales are anticipated to jump 1.4% compared to the earlier 0.2%. Analysts at ING suggest that this unexpected strength could be partly due to consumers front-loading major purchases, anticipating the implementation of new tariffs. Supporting this theory is Wards’ data showing a notable 10.6% monthly surge in auto sales, alongside a jump in credit card spending on electronics and home appliances.
In Canada, market participants are divided over whether the Bank of Canada will opt for a rate cut at this week’s meeting. Although inflation has recently come in higher than anticipated, weakening labor market data and sluggish business sentiment are strengthening the case for easing. Wells Fargo economists point to a March jobs report that showed a drop of 32,600 in employment and a softening business confidence outlook from the BoC’s first-quarter Business Outlook Survey—both of which predated the latest wave of U.S. tariffs.
Last week markets were crazy, with Gold surging $250 in the last three days, EUR/USD surging 5 cents while stock markets opening lower then reversing higher. The moves were massive and volatility immense, so we opened 40 trading signals in total, closing the week with 25 winning signals and 15 losing ones.
Gold Reaches Another Record High Close to $3,200
XAU/USD – Daily Chart
EUR/USD Breaking Above Resistance
The USD/CAD exchange rate has been falling, but it made a significant recovery yesterday as the USD gained some ground and the Canadian CPI inflation rate decreased. After U.S. President Donald Trump announced a 25% tariff on imports from Canada and Mexico, the currency pair first jumped earlier this year, reaching its highest level in almost 25 years at 1.4792 in early February. However, when trade talks went on and some duties were changed, USD/CAD fell back below the handle of 1.40. The market’s response to yesterday’s weak Canadian CPI inflation statistics was a steep 130-pip increase in the USD/CAD exchange rate, which brought the pair back over the 1.3950 level.
USD/CAD – Weekly Chart
Cryptocurrency Update
MAs Keep Pushing BTC Highs Lower
Cryptocurrencies mirrored the intense price swings seen in traditional assets. Bitcoin, which had rallied by $5,000 the previous week amid dovish signals from the Federal Reserve, dropped sharply below its 200-day moving average and fell under the $75,000 mark. However, sentiment quickly turned after former President Trump made remarks that rekindled risk appetite, prompting Bitcoin to surge back above $80,000 with an $8,000 gain. The 50-day moving average also acted as a magnet for buyers, reinforcing the bullish momentum.
BTC/USD – Daily chart
Ripple XRP Finds Resistance at the 50 Daily SMA
Ripple (XRP), in particular, stood out for its relative strength during this period. Even as the broader crypto space faltered, XRP found consistent support around key psychological and technical levels—$2.20, $2.00, and $1.80—anchored by its 200-day moving average. These levels attracted strong buying interest, highlighting the token’s solid demand base despite market volatility.
As global markets staged one of their most robust rallies in recent months by midweek, digital assets joined the upswing. Ripple led the charge, reclaiming the $2 threshold and helping to restore investor confidence as the market prepared for its next phase of consolidation.
XRP/USD – Daily Chart
- Check out our free forex signals
- Follow the top economic events on FX Leaders economic calendar
- Trade better, discover more Forex Trading Strategies
- Open a FREE Trading Account
ABOUT THE AUTHOR
See More
Skerdian Meta
Lead Analyst
Skerdian Meta Lead Analyst.
Skerdian is a professional Forex trader and a market analyst. He has been actively engaged in market analysis for the past 11 years. Before becoming our head analyst, Skerdian served as a trader and market analyst in Saxo Bank's local branch, Aksioner. Skerdian specialized in experimenting with developing models and hands-on trading. Skerdian has a masters degree in finance and investment.
Related Articles
Comments
0
0
votes
Article Rating
Subscribe
Login
Please login to comment
0 Comments
Oldest
Newest
Most Voted
Inline Feedbacks
View all comments


