Bitcoin Wobbles Below $84,000 as ETF Inflow Concerns and Death Cross Loom
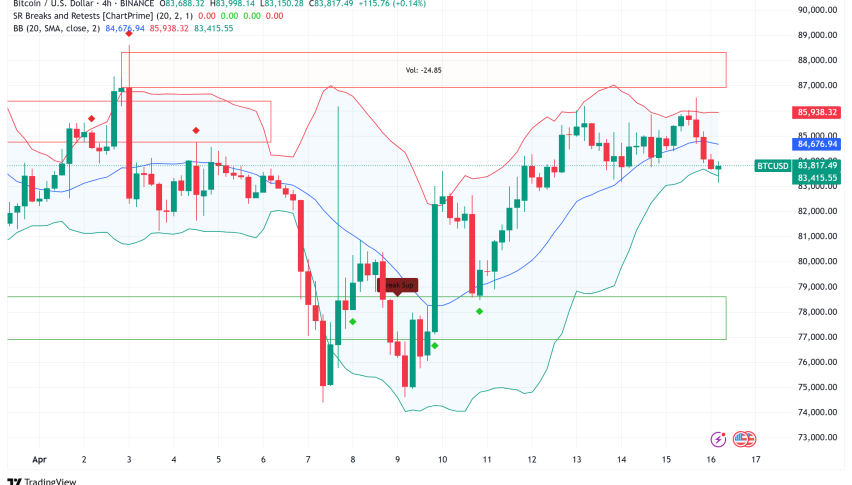
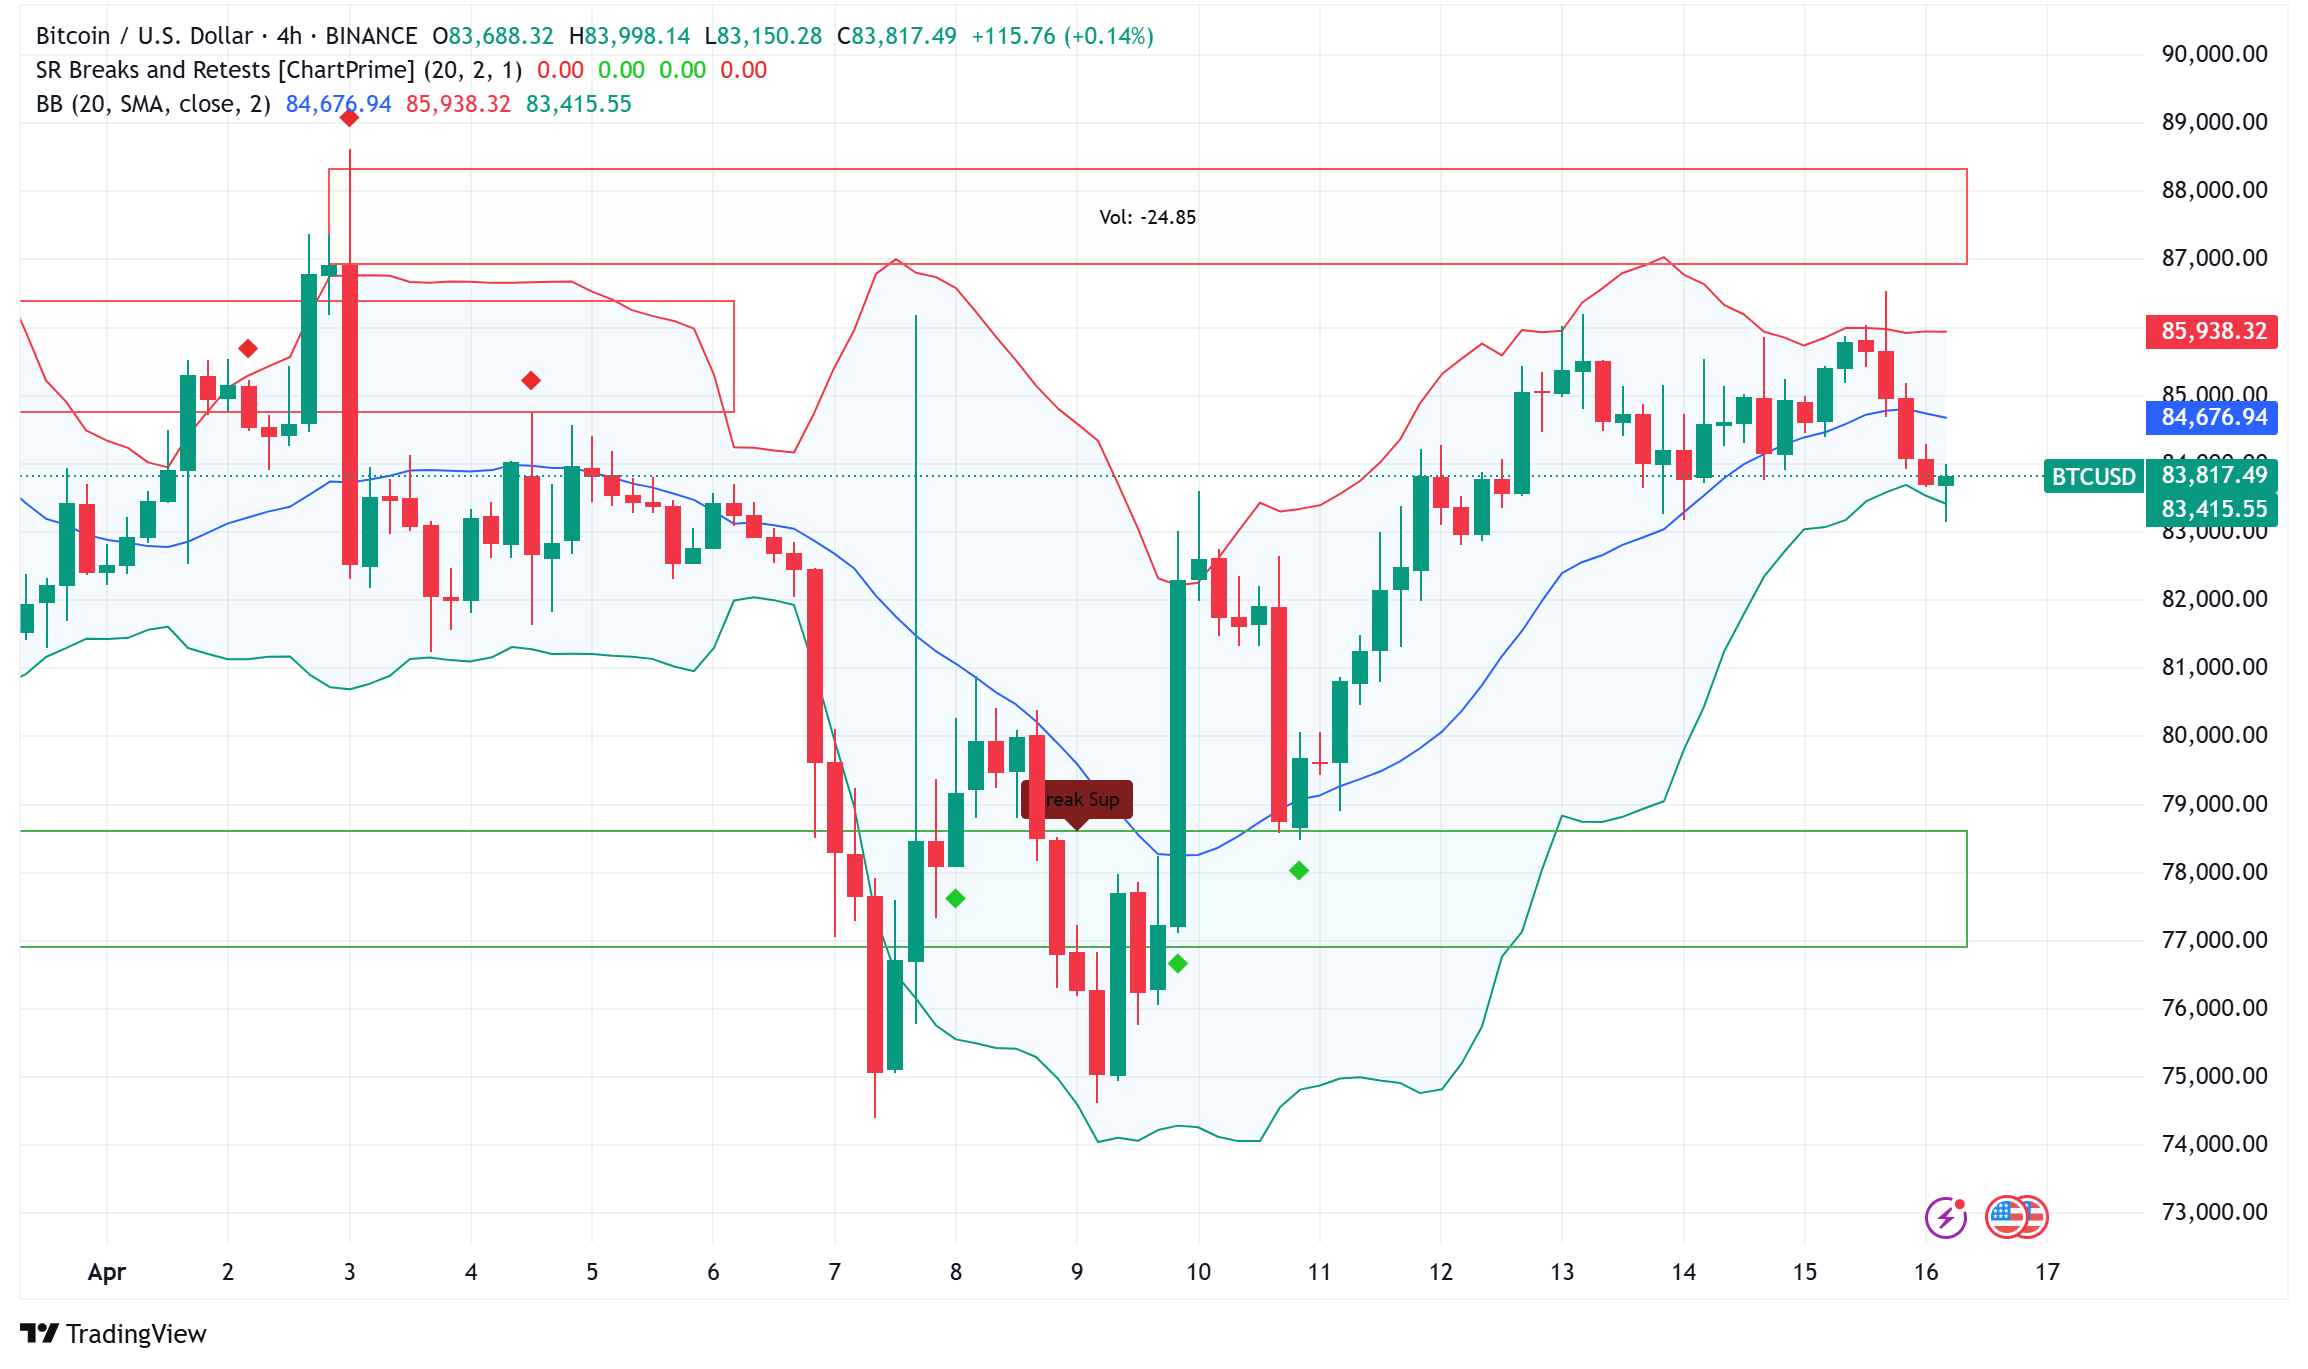
Bitcoin (BTC) is currently trading below the $84,000 mark, down by over 1.5% in the past 24 hours, as investors grapple with concerns over
Live BTC/USD Chart
Bitcoin (BTC) is currently trading below the $84,000 mark, down by over 1.5% in the past 24 hours, as investors grapple with concerns over weakening inflows into spot Bitcoin ETFs and the persistent bearish signal of a death cross on the charts.
Spot Bitcoin ETF Outflows Raise Questions About Institutional Interest
Between April 3 and April 10, the spot Bitcoin ETF market had notable net withdrawals of $872 million, which sparked discussion over whether institutional excitement for the digital asset is declining. With especially alarming data showing daily net flows below $2 million on both April 11 and April 14, the selling pressure matched rising global trade tensions and growing recession fears.
Notwithstanding these outflows, overall the picture points to the ETF market staying strong. Over the past 30 days, daily trading volumes for Bitcoin ETFs averaged an amazing $2.75 billion; but recent activity has dropped roughly 18% below this average. Though quite new to the market, this volume positions Bitcoin ETFs favorably in the ETF ecosystem ahead of US Treasury ETFs ($2.1 billion) and approaching the volume of gold ETFs ($5.3 billion).
With notable holders including Brevan Howard, D.E. Shaw, Apollo Management, and many pension funds including the State of Wisconsin Investment, the amassing of about $94.6 billion in assets under management across Bitcoin ETFs marks notable institutional adoption.
BTC Mining Companies Adapt Strategies Amid Market Pressures
Companies mining Bitcoin are changing their plans to withstand market volatility. CleanSpark revealed on April 15 a strategy toward financial self-sufficiency, intending to sell a piece of its newly mined Bitcoin monthly while receiving a $200 million credit facility through Coinbase Prime.
With the CoinShares Crypto Miners ETF (WGMI) down more than 40% since the start of 2025, mining stocks have seen significant drops and this strategic turn-about comes as result. The decline shows declining values as well as more operational difficulties when Bitcoin’s April 2024 halved, therefore lowering mining incentives by 50%.
The recently revealed tariff proposals by President Trump have put more strain on mining businesses depending on imported hardware, leading to operational changes all around.
BTC/USD Technical Analysis: Death Cross Forms Amid Price Stability
Complicating Bitcoin’s view, a possibly bearish technical pattern developed on April 6 when Bitcoin’s 50-day moving average crossed below its 200-day moving average, therefore producing what traders refer to as a “death cross.” This represents the eleventh such event in the annals of Bitcoin BTC/USD.
Two different patterns are revealed by historical study of past death crosses: severe crosses during bear markets (lasting 9-13 months with 55-68% drawdowns) and milder events (lasting 1.5-3.5 years with much lower falls). The main concern for investors is into which category the present development belongs.
On the importance of this technical pattern, market analysts still vary. With alarming discrepancy between realized market cap and current market cap, CryptoQuant CEO Ki Young Ju advises this could indicate 6-12 months of declining price action. On the other hand, Coin Shares head of research James Butterfill dismisses the death cross as “empirical nonsense,” citing statistics showing Bitcoin values are usually only marginally down one month after a death cross (-3.2%), and often higher three months later.
Bitcoin Price Outlook: $90,000 Resistance Looms
For bulls, Bitcoin’s comeback from its $74,500 annual low has been welcome; April shows a 3.77% return following February and March drawdowns. Still, a number of elements point to resistance around $90,000 capping very immediate gains.
Market data shows that the recent surge is more driven by leverage than by robust spot buying. Although the 30-day apparent demand for Bitcoin is recovering, it is net negative historically, implying a period of sideways price action before lasting progress may start.
Between $80,000 and $90,000 there also are notable liquidation clusters with $6.5 billion in short positions at risk should Bitcoin hit $90,035 and $4.86 billion in long positions susceptible should price drop to $80,071. These liquidation levels sometimes cause volatility when the market tests both sides before deciding on a prevailing trend.
- Check out our free forex signals
- Follow the top economic events on FX Leaders economic calendar
- Trade better, discover more Forex Trading Strategies
- Open a FREE Trading Account

