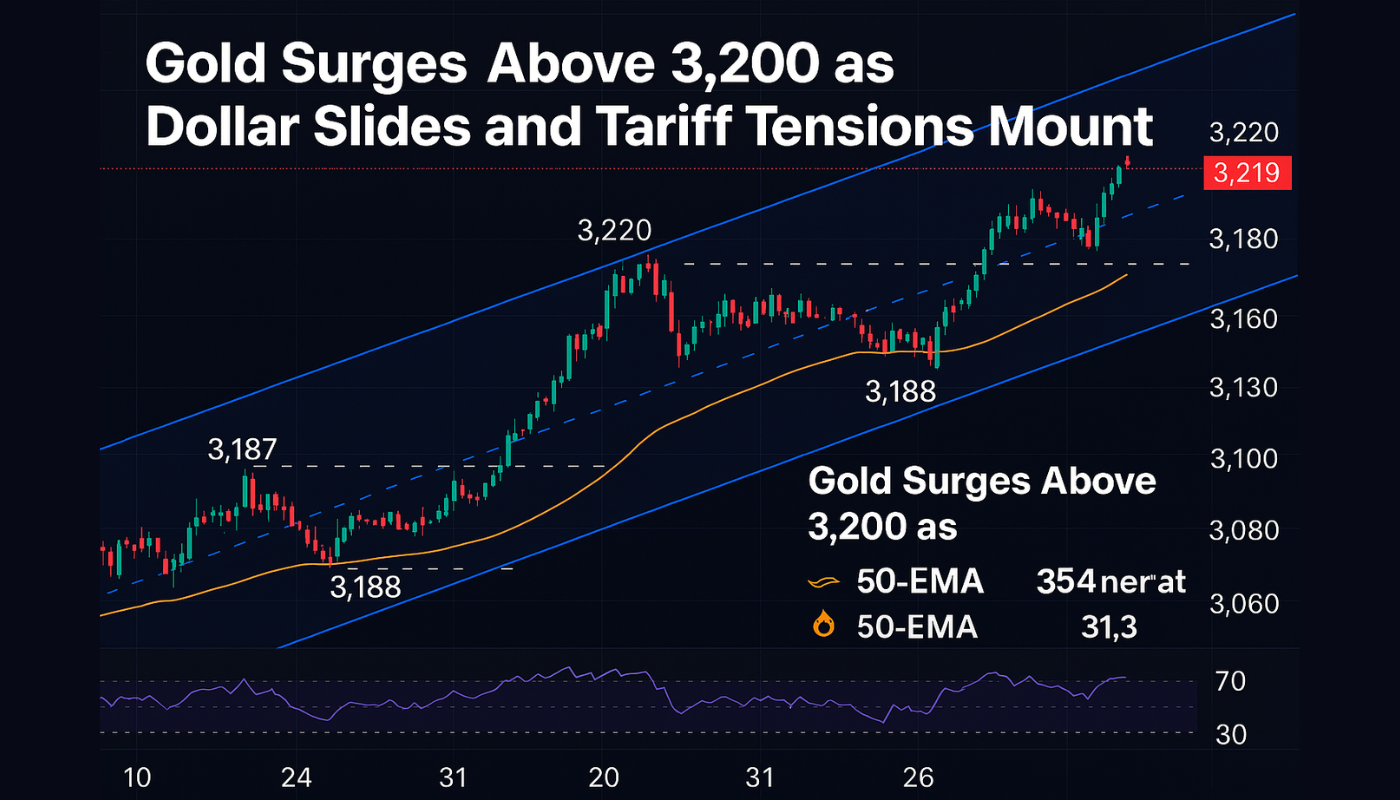
Gold Surges Above $3,200 as Dollar Slides and Tariff Tensions Mount
Gold (XAU/USD) broke $3,200 for the first time on Friday as the U.S. dollar fell sharply and U.S.-China trade tensions escalated.
The U.S. Dollar Index (DXY) dropped 1% making gold more attractive to international buyers and increasing safe-haven flows.
This came after Trump raised tariffs on China to 145% and temporarily suspended tariffs on 60+ countries for 90 days. The mixed tariff strategy spooked markets and caused volatility across global equities and bonds.
“The USD weakness is the main driver of gold’s move. It reflects broader unease across dollar-based assets, especially with equities and bonds under pressure from tariff uncertainty,” said Ilya Spivak, Head of Global Macro at Tastylive.
Equities sold off and China vowed retaliatory tariffs that could take U.S. duties to 84% or more, further increasing trade risks and gold’s appeal as a hedge.
Inflation Surprise and Fed Rate Cut Expectations
Gold’s breakout was also driven by the weaker-than-expected March CPI report. While headline inflation was negative month-over-month, core CPI remained high and real yields are under pressure. This has shifted Fed policy expectations big time.
Traders now price in over 100 basis points of rate cuts by the end of 2025 and a 70% chance of a cut in June according to Fed Funds futures. Lower rates reduce the opportunity cost of holding gold and are boosting institutional and retail demand.
Macro Drivers
U.S. Dollar Index (DXY) down ~1%
Tariff hike to 145% on China; 90-day pause for others
Fed rate cut odds 70% in June
China’s retaliation: 84%+ duties on U.S. goods
Safe-haven demand rising with equity volatility
Technical View: Bullish but Overbought
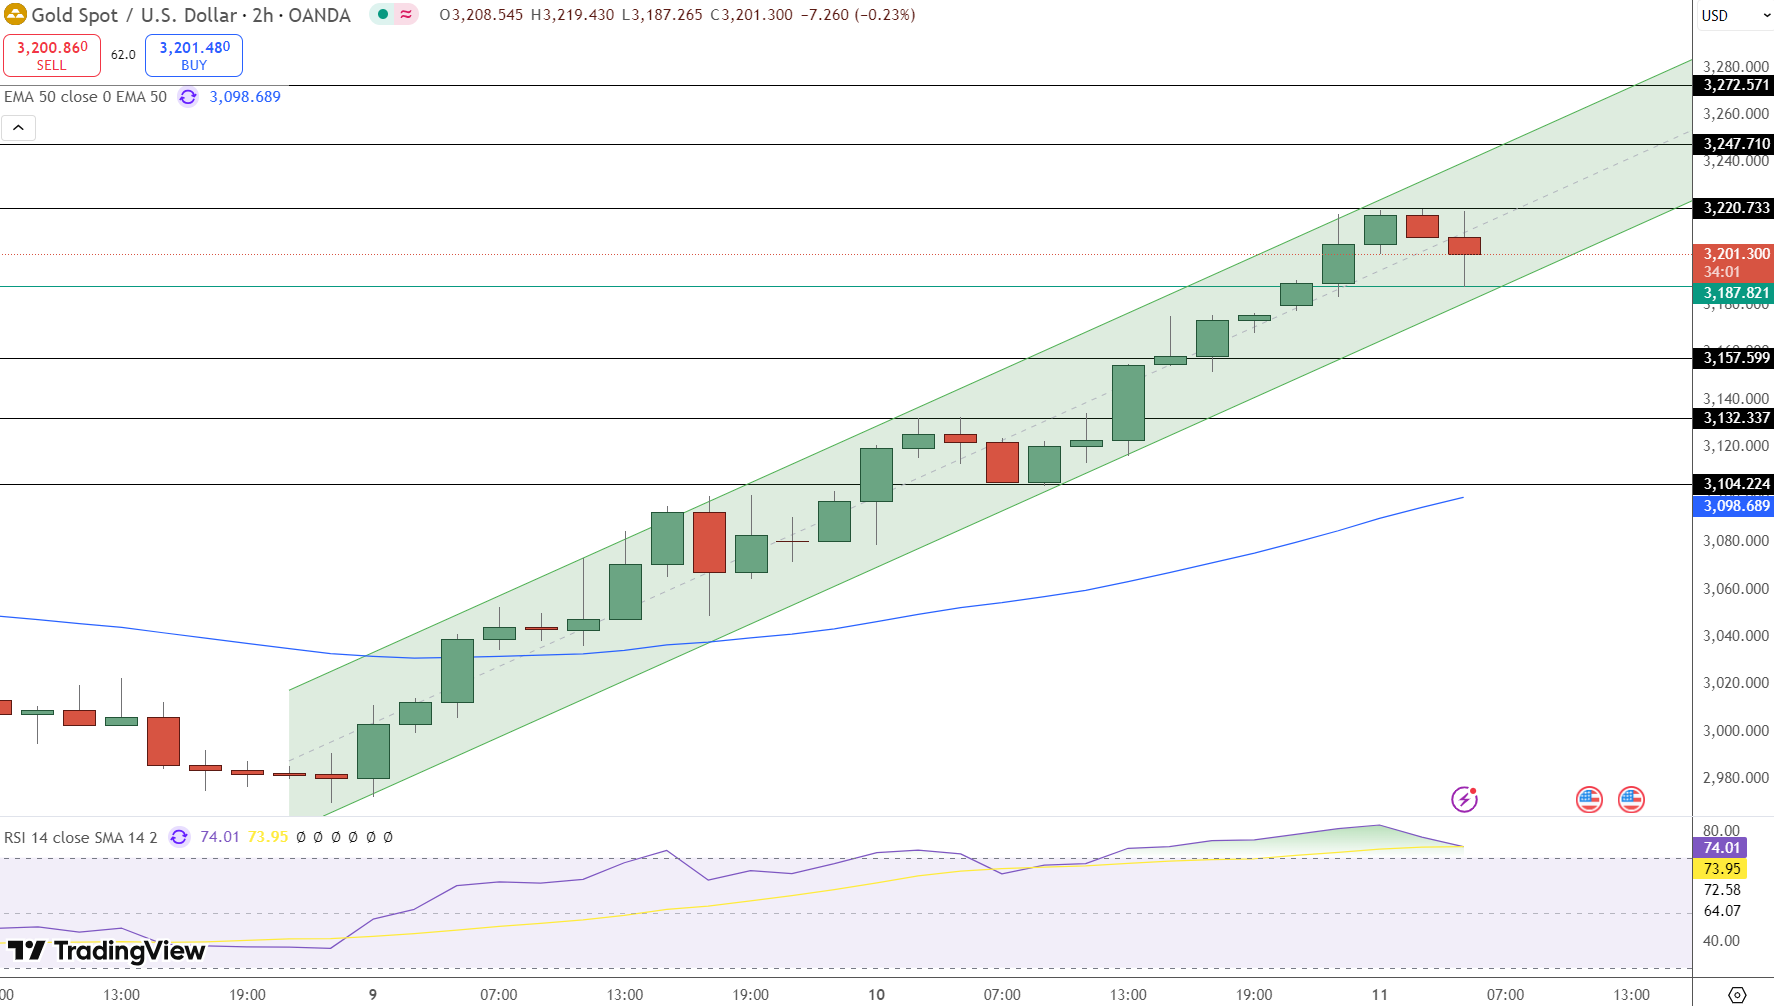
Gold is consolidating just below $3,220 after hitting $3,219 and still within a rising channel on the 4-hour chart. The 50-EMA at $3,098 is acting as support and the RSI near 74 is overbought.
Levels to Watch:
Resistance: $3,220 • $3,247 • $3,272
Support: $3,187 • $3,157 • $3,132
50 EMA (4H): $3,098
RSI (14): ~74 – Overbought
Momentum is still bullish but we need to be cautious. A clean break above $3,220 could trigger the next leg up to $3,247 but failure to hold $3,187 could lead to a healthy correction.
Conclusion
Gold’s move above $3,200 is driven by dollar weakness, trade tensions and Fed policy shifts. While the trend is intact, we should watch the $3,187–$3,220 zone for continuation or correction. A break or rejection at these levels will likely decide gold’s next move in a very volatile environment.

Sidebar rates
Related Posts
