Profit Taking Sinks S&P 500, Nasdaq 5% Despite Tariff Pause and CPI Cooldown

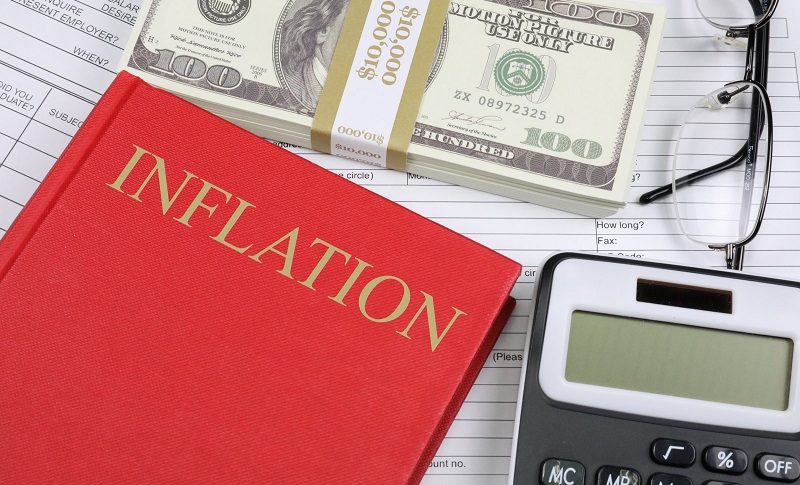
US CPI inflation fell to 2.4% in March, but stock markets have turned bearish, withe S&P 500 falling almost 5% despite the tariff pause by US President Trump.

Market Recap and Outlook:
After a historic surge in equities that saw the S&P 500 and Nasdaq jump nearly 10% in a single session, markets pulled back sharply on Wednesday, with both indices giving back around 5%, erasing half of yesterday’s gains.
Despite positive tailwinds—including a cooler-than-expected March CPI report and a temporary pause on new tariffs—profit-taking was evident. Much of Tuesday’s explosive move was driven by short-covering and relief positioning, with many bears exiting at once. Now, traders who bought during the rally are locking in profits, contributing to today’s pullback.
S&P 500 Chart Daily – Half of Yesterday’s Gains Are Gone

The lower CPI print bolstered hopes for a more dovish Federal Reserve stance, reinforcing expectations that rate cuts may be closer than previously thought. However, that optimism is being tempered by renewed tensions with China, particularly over tariffs. The latest round of proposed duties would push the total tariff rate on Chinese goods to 145%, including a new 20% fentanyl-related levy. That said, these rates do not yet apply to goods currently en route, offering a window for further negotiation.
Adding to the broader market tension, the Fed remains cautious, prioritizing tariff impacts over inflation data for now. Nonetheless, the CPI report strengthens the case for potential monetary easing later this year. Meanwhile, the US dollar is broadly weakening, reflecting growing expectations of future rate cuts and heightened trade risk.
US March 2025 CPI Report – Key Highlights

Headline CPI:
Y/Y: +2.4% (vs +2.6% expected, prior +2.8%)
M/M: -0.1% (vs +0.1% expected)
Unrounded: -0.088% (prior +0.216%)
Core CPI:
Y/Y: +2.8% (vs +3.0% expected)
Lowest core inflation print since 2021
M/M: +0.1% (in line with expectations)
Unrounded: +0.116% (prior +0.227%)
Core Services Breakdown:
Core services M/M: +0.126% (prior +0.252%)
Core services ex-shelter: +0.1% (vs +0.3% prior)
Core CPI services ex-rent/OER: +0.095% (vs +0.3% prior)
Services ex-energy: +0.160% (vs +0.24% prior)
Other:
Real weekly earnings: Flat (vs +0.1% prior)
The March CPI report delivered a meaningful downside surprise, particularly in core inflation, which came in at its lowest year-over-year pace since 2021. Headline inflation also showed a rare month-over-month decline. Services inflation, often sticky and Fed-sensitive, showed a notable easing—especially excluding shelter and rent components.
While this won’t guarantee an imminent Fed pivot, it does strengthen the case for policy easing later in the year, especially if the trend continues. Investors should have interpreted this as a green light for risk assets such as stock markets in the short term, but the trade tariffs and position closing are having a bigger impact on the.
S&P 500 Live Chart
Sidebar rates
Related Posts
