btc-usd
Forex Signals Brief April 9: Tariffs Dictate Direction for Stocks, FX & Gold
Skerdian Meta•Wednesday, April 9, 2025•3 min read
Yesterday markets reversed lower as tariffs were the biggest driver again, so today that will be the main theme again.
With no major economic data on the docket, markets on Monday were driven almost entirely by speculation over whether President Trump would delay new tariffs—including an additional 50% duty on Chinese imports and reciprocal tariffs on other global trade partners—set to take effect at midnight New York time.
U.S. equities opened strongly, lifting risk sentiment and boosting commodity currencies. The yen weakened slightly, while AUD/USD briefly rallied to 0.6095. But as the session wore on, doubts crept in. Some investors started taking profits into a 4% stock market rally, and hopes were further dampened by ambiguous signals from the White House. Despite officials urging China to re-enter talks, there were no clear commitments to pause the tariff hikes.
Adding to jitters, the yuan slid to a record low, which many in the market interpreted as a retaliatory signal. Meanwhile, U.S. officials maintained that trade deals would likely proceed with current tariffs still in place. Without confirmation of a postponement, uncertainty took hold.
By session’s end, the S&P 500 had tumbled 6% from its highs and the Nasdaq nearly 7%. In currencies, USD/CAD jumped 115 pips, while AUD/USD slipped to 0.5955.
Today’s Forex Events
In New Zealand, attention is on the Reserve Bank’s upcoming policy meeting—the first under Acting Governor Hawkesby following the early departure of Governor Orr. A Reuters poll showed all 31 surveyed economists expecting a 25bps cut to 3.50%, with markets assigning a 97% probability to that outcome. The chance of a more aggressive 50bps cut is just 3%.
This would mark the RBNZ’s fifth consecutive cut, following a 50bps move in February. With inflation slowing and economic momentum weakening, the central bank has signaled further easing may be on the table in 2025.
FED Holds Steady, Flags Uncertainty
As expected, the Federal Reserve left rates unchanged in March and stuck to its projection of two rate cuts later in the year. However, the Fed dropped language suggesting a balance of risks and highlighted growing uncertainty in the outlook.
While reaffirming that the U.S. economy and labor market remain solid, the Fed acknowledged inflation remains “somewhat elevated” and revised its growth forecasts lower for 2025 and 2026. It also raised its projections for PCE inflation and unemployment, pointing to a more cautious path ahead.
The U.S. stock market and the dollar experienced weakness throughout the week apart from Friday when it reclaimed some of the losses, with extreme volatility dominating trading activity. As a result, we executed 39 trading signals this week, with 25 wins and 14 losses, navigating the unpredictable market swings.
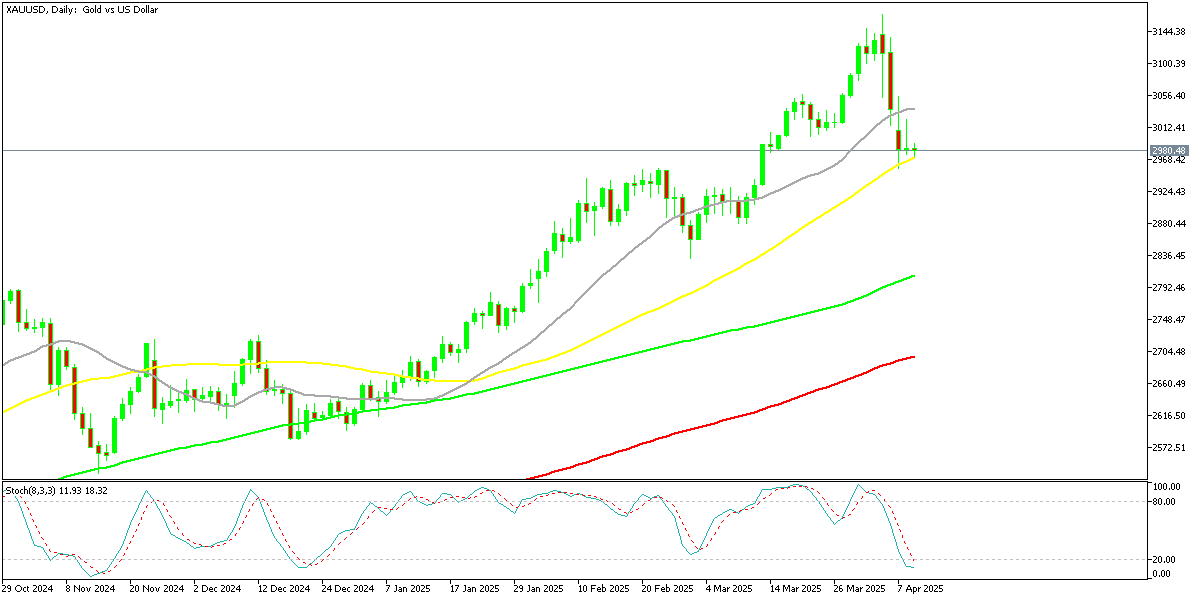
Gold Remains Below $3,000 but the 50 Daily SMA Holds
A major shift unfolded late last week in precious metals markets. For the first time since March 17, gold closed below the key $3,000 level, falling more than $200 from its recent peak. The sell-off was triggered by the announcement of sweeping new trade tariffs on Wednesday, sparking a global wave of risk-off sentiment. By Friday, gold had dropped over 3% in a single session as fears of a recession grew and equity markets declined sharply.
Despite the steep fall, gold found support near the 50-week simple moving average (SMA)—a historically reliable technical zone—helping stabilize the price heading into this week.
XAU/USD – Daily Chart
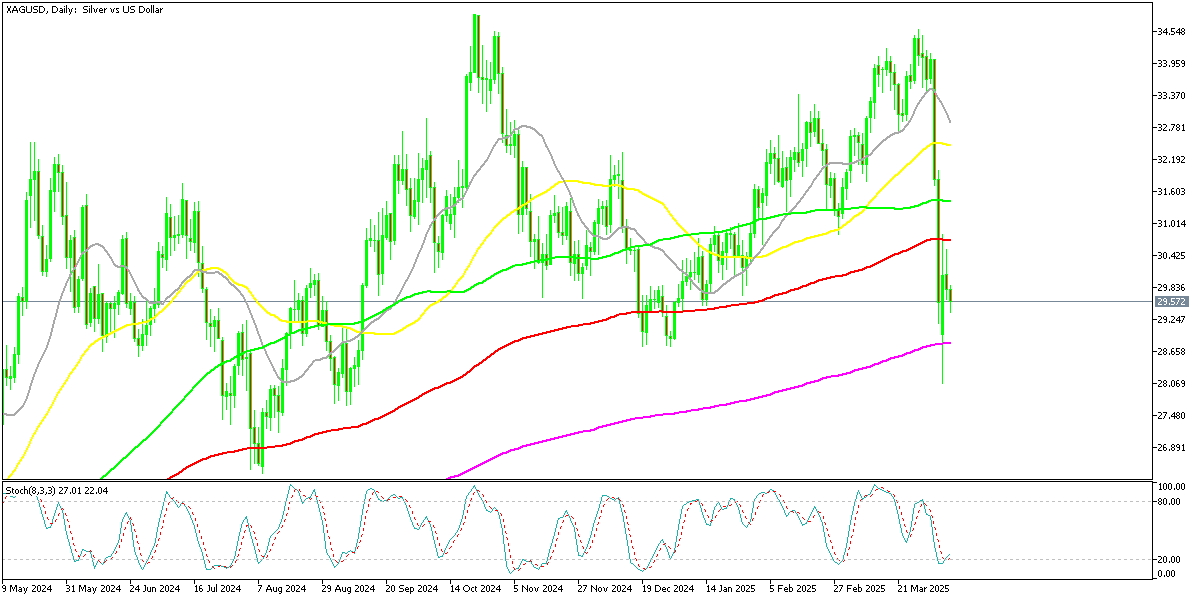
Silver trades Between 2 MAs
Silver (XAG/USD) followed a similar trajectory, although with greater volatility. While the metal had climbed more than $5 since the beginning of the year, it ran into stiff resistance around the $34.50 area. As bullish momentum faded last week, silver saw a dramatic pullback of nearly 15%, briefly falling to $28.05.
Support once again emerged near the 50-day SMA, a level that has repeatedly helped stall declines in recent corrections. Early today, silver rebounded back above the $30 mark, gaining around 3%. However, it faces a fresh technical barrier near $30.80, where the 50 SMA—previously support—has now flipped into resistance. This level will likely pose a key challenge for bullish continuation.
Silver XAG/USD – Daily Chart
Cryptocurrency Update
Bitcoin Slips Below $80K
Cryptocurrencies remain highly volatile. After dovish signals from the Federal Reserve hinted at a more accommodative stance, Bitcoin (BTC) rallied $5,000 earlier last week. The move, however, ran into resistance near the 20-day moving average, and the momentum faded. Once Bitcoin dipped below its 200-day average, bearish pressure increased, dragging the price below $75,000. A late rebound helped lift it back above key support, suggesting buyers are still active—but fragile sentiment persists.
BTC/USD – Daily chart
Ripple XRP Makes the Bearish Break
Ripple (XRP) also experienced intense swings. It briefly spiked to $2.98 in March after reports surfaced that President Trump had discussed digital assets in the context of a proposed National Crypto Reserve. However, enthusiasm quickly faded once it was clarified that tokens like XRP, Solana, and Cardano would not be part of the initiative.
By Saturday, XRP had bounced back to $2.07 after dipping below $2, finding support around $1.90. The rally proved short-lived, with the price dropping to $1.63 on Sunday before recovering to close the day back at $1.90.
XRP/USD – Daily Chart
Skerdian Meta
Lead Analyst
Skerdian Meta Lead Analyst.
Skerdian is a professional Forex trader and a market analyst. He has been actively engaged in market analysis for the past 11 years. Before becoming our head analyst, Skerdian served as a trader and market analyst in Saxo Bank's local branch, Aksioner. Skerdian specialized in experimenting with developing models and hands-on trading. Skerdian has a masters degree in finance and investment.
XRP is setting up for a massive breakout—but not before one final dip, according to XForced Global, who uses Elliott Wave theory to chart...