Ethereum Plunges Below $1,500 Amid Market Capitulation as Key Metrics Signal Potential Bottom

Ethereum (ETH) has plummeted to around $1,460, marking a steep 7% decline in the past 24 hours and extending its downward trajectory that has seen the cryptocurrency lose 65% of its value over the past three months. The second-largest cryptocurrency by market capitalization, ETH/USD is now trading below its 2018 market cycle peak, effectively wiping out seven years of gains against Bitcoin BTC/USD.
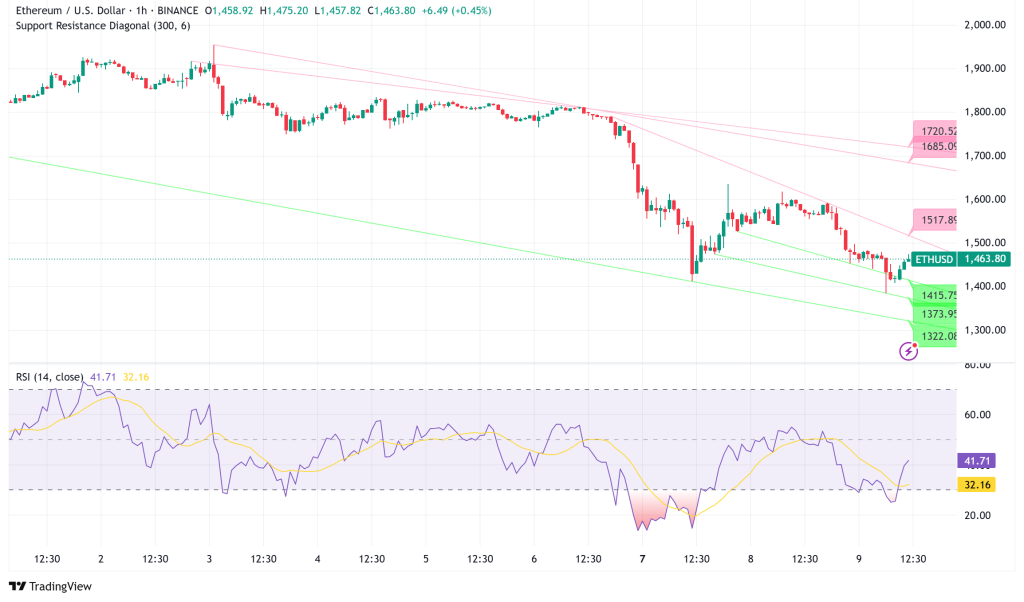
The ETH/BTC ratio has reached a five-year low of 0.018, levels not seen since December 2019. Historical data reveals a sobering reality for Ethereum investors: since its launch in mid-2015, ETH has only outperformed Bitcoin for approximately 15% of all trading days, with Bitcoin dominating performance metrics for the past five consecutive years.
ETH Whale Activity Signals Market Sentiment
Recent blockchain data reveals notable whale migration among market collapse. One well-known ETH investor who has kept a 10,000 ETH position for almost 900 days lately sold their whole interests. Originally paying almost $13 million at an average price of $1,295 each token in late 2022, the whale sold the tokens for a meager profit of $1,678.
Especially, this whale lost the chance to sell when ETH hit $4,000 in December, so avoiding a possible peak profit of $27.6 million.
Separately, Donald Trump-backed cryptocurrency startup World Liberty Financial (WLF) allegedly sold 5,471 ETH valued around $8.01 million at $1,465 per token. Given World Liberty Financial apparently bought its ETH at an average price of $3,259, this sale seems to have been at a major loss.
Ethereum’s On-Chain Metrics Enter “Capitulation” Phase
The “capitulation” zone—a phase in which most investors are holding ETH at a loss—has Ethereum’s Net Unrealized Profit/Loss (NUPL) measure entered. Similar movements into this zone have historically been near to major market bottoms, as seen in March 2020 and June 2022, right before notable price recovery.
Ethereum has also dropped below its Realized Price, an on-chain metric of average acquisition cost over the blockchain. Analyst Kriptolik claims that this usually corresponds with:
An increase in loss-driven selling as investors react to being in the red
The capitulation phase, where market confidence erodes leading to widespread selling
Strategic accumulation opportunities, as past data shows such periods have consistently preceded strong recoveries
ETH/USD Technical Analysis Points to $1,000 as Potential Bottom
Current price action reveals disturbing similarities to previous market cycles, specifically the patterns observed in 2018 and 2022. Technical analysts have identified a recurring fractal pattern characterized by higher price highs accompanied by lower highs in the relative strength index (RSI)—a classic bearish divergence signaling weakening momentum.
The weekly RSI for Ethereum currently remains above the oversold threshold of 30, suggesting there may be room for further decline before a reversal can be expected. Based on Fibonacci retracement levels and historical patterns, analysts project a potential bottom in the $990-$1,240 range, which would align with the 0.618-0.786 Fibonacci retracement area.
Broader Market Context
The fall in Ethereum coincides with a general sell-off in cryptocurrencies allegedly driven by the Trump government’s extensive worldwide tariffs. Some technical indications point to the asset approaching oversold levels, maybe indicating a market bottom developing despite the present decline.
Although most long-term ETH investors are currently losing money, technical patterns and on-chain data point to Ethereum perhaps in the latter leg of its fall. If past trends replicate, current price levels could be a smart accumulation zone for investors looking ahead.

Sidebar rates
Related Posts
