Ethereum Rebounds 10% to $1,550 Following Two-Year Low, But Challenges Remain

Ethereum (ETH) has bounced back to around $1,550, posting a nearly 10% gain in the past 24 hours after briefly touching a two-year low of $1,410 earlier this week. This rebound offers a glimmer of hope for investors who witnessed ETH’s dramatic 27% crash within a 48-hour period, which triggered significant market liquidations and investor losses.
Massive ETH Liquidations Shake Market Confidence
With Coinglass data indicating about $370 million in leveraged ETH futures sold over only two days, the latest price fall rocked Ethereum’s derivatives markets. Based on Santiment statistics, short-term holders led the selling push after experiencing Monday alone losses of almost $500 million.
Sky (previously Maker) liquidated a whale’s collateral of 53,074 ETH worth around $74 million, among other somewhat remarkable liquidations. On Monday, lending platform Aave noted approximately $162 million in liquidated collateral, underscoring the broad influence of the price decline over the DeFi network.
DeFi Liquidation Risks Could Amplify Price Movements
Potential DeFi liquidations impose more strain on the Ethereum ecosystem. One particularly under observation is a whale with 220,000 ETH in collateral who lately contributed 10,000 ETH and 3.52 million DAI to lower their liquidation price to $1,119. Should ETH fall below this level, the whale runs the danger of losing all of their collateral, hence igniting additional selling pressure.
Professional Traders Show Resilience Despite Market Weakness
Professional traders have not entirely given up hope even with the extreme price corrections. Derivatives data indicates that although sentiment is pessimistic, it has not descended to panic levels usual of market bottoms. Though still much below the high levels of 20% observed during past strong drops, the ETH options skew shows negative attitude.
Though still below the neutral level of 5%, the monthly futures premium has increased to 4% after declining to 3%, indicating some stability in market attitude. This implies that instead of complete surrender, dealers should use a wary attitude.
Ethereum’s On-Chain Metrics Show Underlying Strength
Positively, Ethereum’s network architecture keeps proving to be robust. On April 6, the Ethereum network’s overall value locked (TVL) peaked at 30.2 million ETH, a 22% rise over last month. Over the same period, this rise exceeded rivals such Solana (12% increase) and BNB Chain (16% increase).
Nonetheless, investors should be aware that Ethereum’s price is still down 67.45% from its all-time high of $4,864.06 established in November 2021, underlining the considerable recovery still required to recoup former peaks.
Macro Factors and Development Delays Weighing on Sentiment
More general macroeconomic issues, such world trade tensions and anxiety about the Federal Reserve’s monetary policies, nevertheless greatly affect Ethereum’s price movement. Though US President Donald Trump has pushed for interest rate reductions, Fed Chair Jerome Powell has stayed wary about inflation prospects, therefore casting uncertainty on risk asset markets.
Complicating Ethereum further, developers recently postponed the expected Pectra upgrade from April to May 7 without offering any clear explanation. This is true even if the Hoodi testnet upgrade on March 26 was implemented successfully, therefore creating possible market uncertainty.
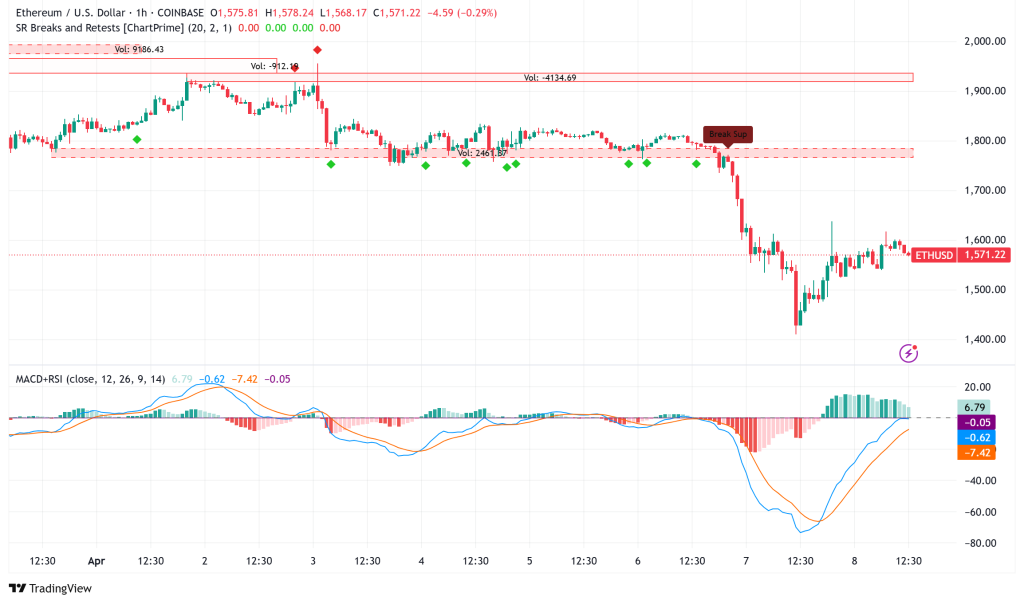
ETH/USD Technical Outlook: Key Levels to Watch
Currently struggling below the $1,550 support level, Ethereum ETH/USD has momentarily bounced off the lower limit of a declining channel running back to December. On hourly charts, the immediate resistance shows as $1,620 and a negative trend line.
Should ETH fall from its present level, additional downside might target the $1,505 support zone and follow with subsequent support at $1,420. A breakout below these levels might bring prices toward the psychologically critical $1,000 barrier, particularly if the lower bound of the declining channel is crossed.
On the plus side, ETH encounters fierce opposition close to $1,700; more obstacles at $1,720 and $1,820 While the Relative Strength Index (RSI) has entered oversold circumstances, implying the possibility for a short-term reversal, technical indicators indicate the Moving Average Convergence Divergence (MACD) histogram bars below neutral area.

Sidebar rates
Related Posts
