16% YTD Surge: Gold Breaks $3,000 as Central Banks Ditch Dollars
Gold’s break above $3,000 per ounce isn't just symbolic—it marks a structural shift in how markets respond to global risk...
Gold’s break above $3,000 per ounce isn’t just symbolic—it marks a structural shift in how markets respond to global risk.

Spot gold touched $3,167.57 last week, gaining 16% year-to-date after a 27% rise in 2024. The rally was ignited by sweeping tariffs from U.S. President Donald Trump and intensified by growing global fractures. According to HSBC’s James Steel, this marks the first time since 1980 that geopolitics—not just inflation or interest rates—are primary market drivers.
This time, though, there’s no swift path to resolution. Back then, crises like the Iranian Revolution and the oil shock were eventually met with coordinated efforts. Now, international cooperation is largely absent, with Trump signaling a fundamental break in post-WWII alliances. The U.S. has hinted at retracting its European security guarantees, floated annexation proposals, and disrupted the global trade order.
Central Banks Shift from Dollars to Bullion
The Ukraine war catalyzed a significant reallocation of central bank reserves. When Western sanctions froze half of Russia’s foreign currency reserves, only gold remained accessible. That precedent prompted many non-Western central banks to diversify away from the U.S. dollar. Bullion is now not just a hedge—it’s insurance against systemic exclusion from Western financial networks.
At the same time, budget deficits and dovish monetary policies in developed economies have revived retail and institutional interest. According to StoneX analyst Rhona O’Connell, although gold has reached all-time highs in nominal terms, the inflation-adjusted record from 1980 stands near $3,486—still a technical target.
Gold Technical Landscape Suggests Cautious Optimism
Technically, gold (XAU/USD) is trading near $3,012 after rebounding off the $2,971 level. A break below the ascending channel triggered the selloff, with the 50-period EMA at $3,058 now acting as key resistance.
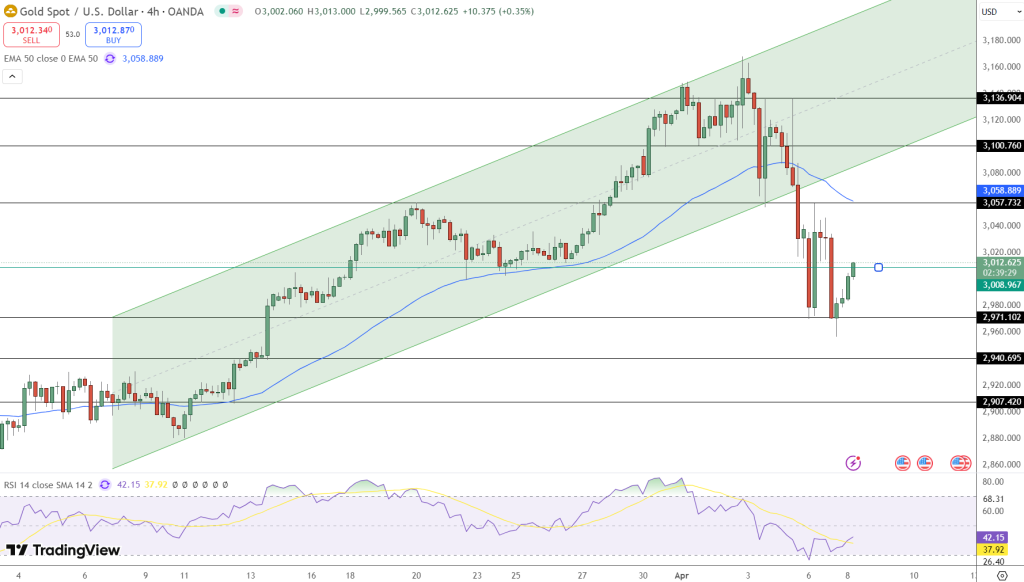
Short-term momentum remains fragile, with the RSI at 42. A push above $3,058 could extend gains toward $3,100 and $3,137. But failure to hold above $3,009 risks a return to the $2,971–$2,941 range. For bulls, the next few sessions are pivotal.
Key Takeaways:
Gold hit a record $3,167, up 16% YTD, driven by tariffs and risk aversion
Central banks are diversifying reserves away from USD, adding to demand
Technical resistance lies at $3,058; support holds at $2,971 and $2,941
- Check out our free forex signals
- Follow the top economic events on FX Leaders economic calendar
- Trade better, discover more Forex Trading Strategies
- Open a FREE Trading Account
Related Articles

Comments
Sidebar rates
Related Posts
