Robinhood (HOOD) Approaches Key Golden Ratio Support — Is a Bullish Reversal Coming?

A Robinhood executive stated that the fintech company plans to deliver a “private banking experience” through its new checking and savings account offerings set to launch this fall. Meanwhile the stock is approaching key Fibonacci support.

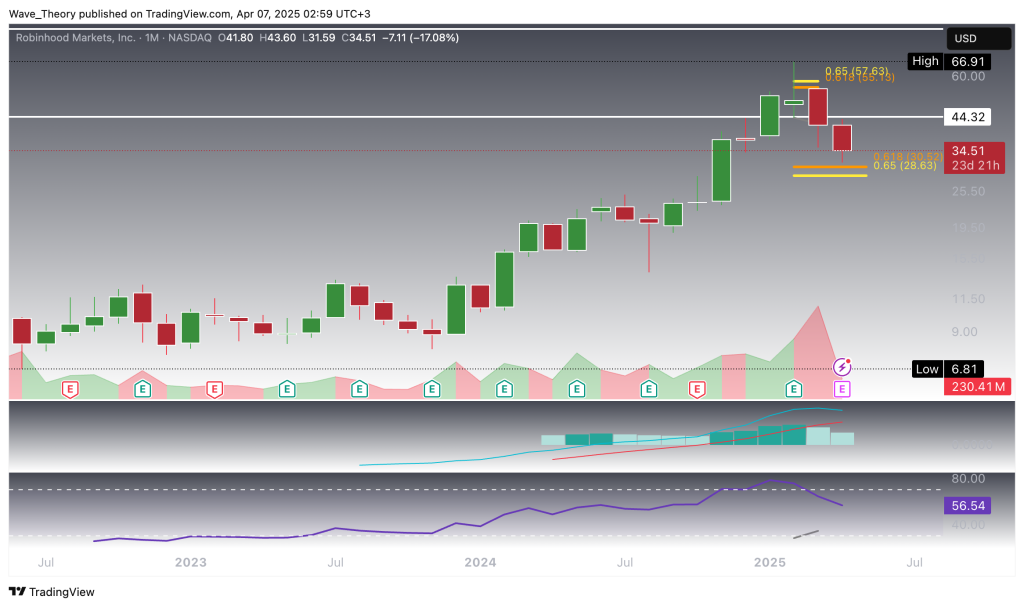
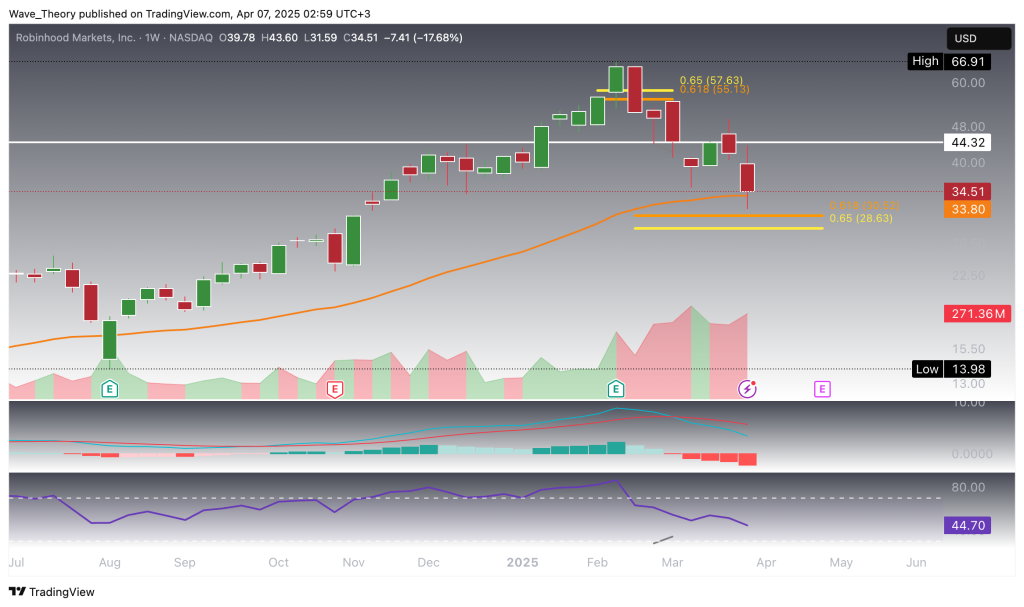
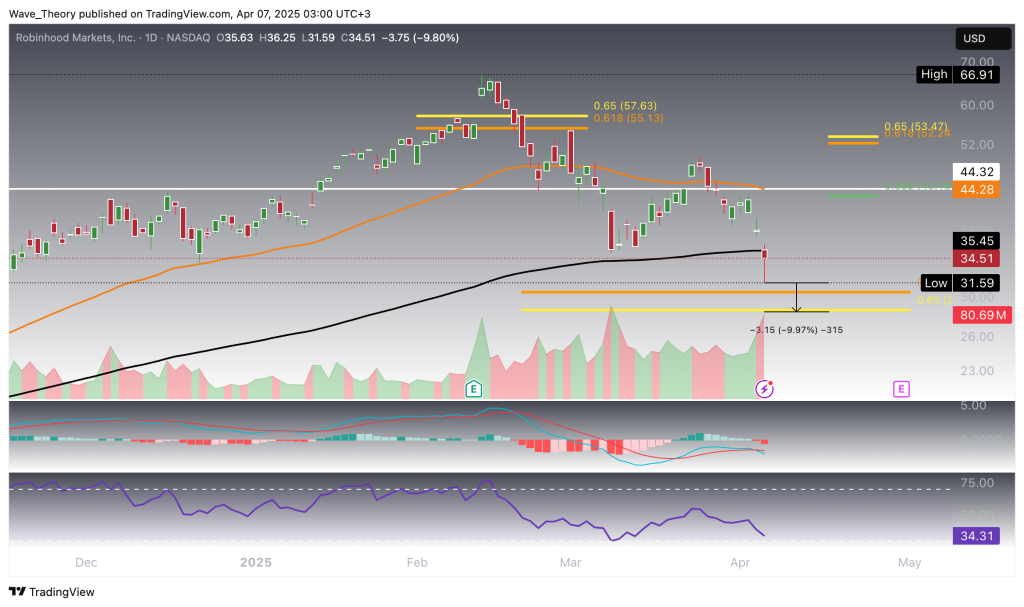
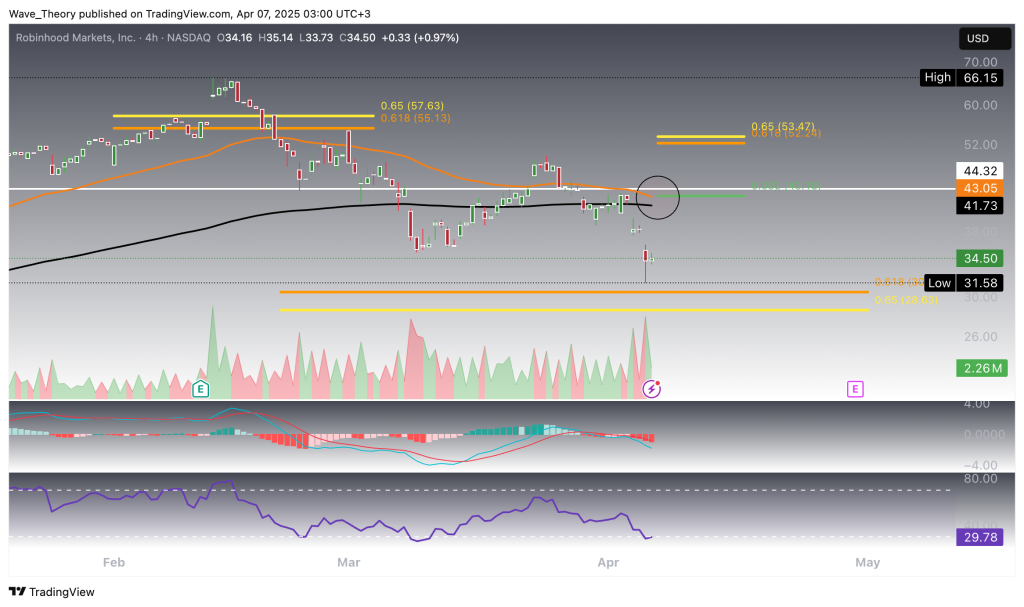
Robinhood (HOOD) Approaches Key Golden Ratio Support at $29 – Will the Bullish Trend Hold?

Robinhood (HOOD) faced a strong rejection at the golden ratio resistance around $57 last month and is now approaching a critical golden ratio support zone near $29. This level will likely act as a pivotal point for price action—so long as HOOD holds above this support, the broader bullish trend remains structurally intact.

However, caution is warranted. The MACD histogram has been trending lower over the past month, reflecting weakening momentum. Still, the MACD lines remain bullishly crossed, indicating the underlying trend has not yet shifted. Meanwhile, the RSI sits in neutral territory, giving neither bullish nor bearish confirmation at this stage.

Robinhood
Robinhood

Robinhood (HOOD) Stock Finds Support at the 50-Week EMA as Bearish Pressure Builds

Before reaching the critical golden ratio support near $29, Robinhood (HOOD) is currently finding interim support at the 50-week Exponential Moving Average (EMA), situated around $33.8. While this level may provide a temporary floor, the weekly technical indicators reflect increasing bearish pressure. The MACD lines are bearishly crossed, and the histogram continues to trend lower, signaling weakening momentum. Meanwhile, the RSI remains in neutral territory, offering no clear directional bias.

Robinhood
Robinhood

Robinhood (HOOD) Stock: Potential 10% Downside as Key Support Nears

Robinhood (HOOD) could face an additional 10% downside if it declines toward the lower bound of the golden ratio support around $28.6. A bullish reversal at this level would position HOOD to retest key Fibonacci resistance levels at $43.2 and $53. A decisive breakout above the golden ratio at $53 would invalidate the ongoing correction and open the path toward the all-time high near $67 — or potentially beyond.

From a technical perspective, daily indicators remain mixed. The Exponential Moving Averages (EMAs) continue to form a golden crossover, supporting a bullish trend in the short- to medium-term. However, the MACD lines are bearishly crossed, and the histogram signals continued downward momentum. Meanwhile, the Relative Strength Index (RSI) is approaching oversold territory but has yet to issue a definitive bullish or bearish signal.

Robinhood
Robinhood

Robinhood (HOOD) 4H Chart: Death Cross Looms, Bearish Pressure Intensifies

On the 4-hour chart, Robinhood (HOOD) is on the verge of forming a death cross, a key bearish signal that could confirm short-term downward momentum. The MACD lines are already bearishly crossed, the histogram continues to tick lower, and the RSI is hovering near oversold territory—yet still offering no indication of a bullish divergence.

Technically, HOOD appears increasingly vulnerable in the immediate term, with another potential 10% downside on the table before a meaningful bullish bounce may occur.

Robinhood
Robinhood
Check out our free forex signals
Follow the top economic events on FX Leaders economic calendar
Trade better, discover more Forex Trading Strategies
ABOUT THE AUTHOR See More
Konstantin Kaiser
Financial Writer and Market Analyst
Konstantin Kaiser comes from a data science background and has significant experience in quantitative trading. His interest in technology took a notable turn in 2013 when he discovered Bitcoin and was instantly intrigued by the potential of this disruptive technology.
Related Articles
Comments
0 0 votes
Article Rating
Subscribe
Notify of
0 Comments
Oldest
Newest Most Voted
Inline Feedbacks
View all comments

HFM

Doo Prime

XM

Best Forex Brokers