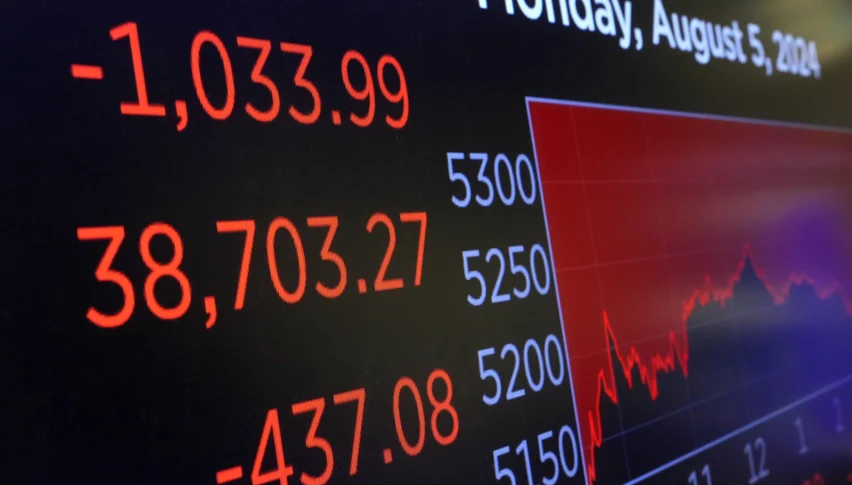
Oil Tanks 10.6% in a Week as Trade War Fears and Supply Surge Hit Hard
Crude oil prices extended last week’s steep losses as the global economic outlook took another hit. WTI crude is now down over 10.6% on the week, dropping 3% on Monday alone to trade near $60.34.

The latest selloff was triggered by deepening trade tensions between the U.S. and China, with Beijing retaliating to President Trump’s new tariffs by slapping a 34% levy on American goods.
Though energy products like oil and gas were exempt from the tariffs, broader concerns around a global economic slowdown continue to dominate sentiment. Fears of a demand collapse have intensified as investors increasingly price in a recession scenario.
WTI crude fell 10.6% last week and 3% on Monday
Brent crude is down 10.9% on the week
China’s new 34% tariff adds to market uncertainty
Fed, OPEC+ and Inflation Add to Downward Pressure
Federal Reserve Chair Jerome Powell added fuel to the fire on Friday by acknowledging the tariffs’ broader economic impact. He warned of higher inflation and slower growth as a result of Trump’s aggressive trade stance. This rhetoric helped push crude prices lower, compounding investor unease.
Adding to bearish pressure, OPEC+ unexpectedly announced it would increase output by 411,000 barrels per day in May—well above the originally planned 135,000 bpd. The group’s move to unwind production cuts established over the past two years sent a clear signal: supply is returning faster than the market anticipated.
“The move represents a major shift in market dynamics,” said Sugandha Sachdeva, founder of SS WealthStreet. “It’s a direct headwind for oil prices in an already fragile macro environment.”
OPEC+ officials also emphasized the importance of compliance and ordered overproducers to submit correction plans by April 15.
Technical Breakdown Signals More Downside
From a technical standpoint, WTI crude broke below key support at $65.40, confirming a bearish continuation pattern. The next downside target lies at the 1.618 Fibonacci extension level of $61.23, followed by deeper support at $58.65. Momentum indicators reinforce this outlook, with the Relative Strength Index (RSI) sitting at 26.77—deep in oversold territory.

Unless oil can reclaim resistance at $65.40 and the 50-day EMA near $69.00, the market remains skewed toward the bears. Any rebound may be short-lived unless supported by a meaningful shift in macroeconomic policy or geopolitical tone.
Outlook Summary:
Breakdown below $65.40 confirms bearish bias
RSI oversold, but recovery lacks catalyst
Recession fears and oversupply pressure persist
In the short term, oil markets remain trapped between rising supply and slowing demand, with policy clarity and trade de-escalation needed to stabilize prices.

Sidebar rates
Related Posts
