Dogecoin Stabilizes Above $0.16 Amid Volatile Trading Week and Whale Accumulation
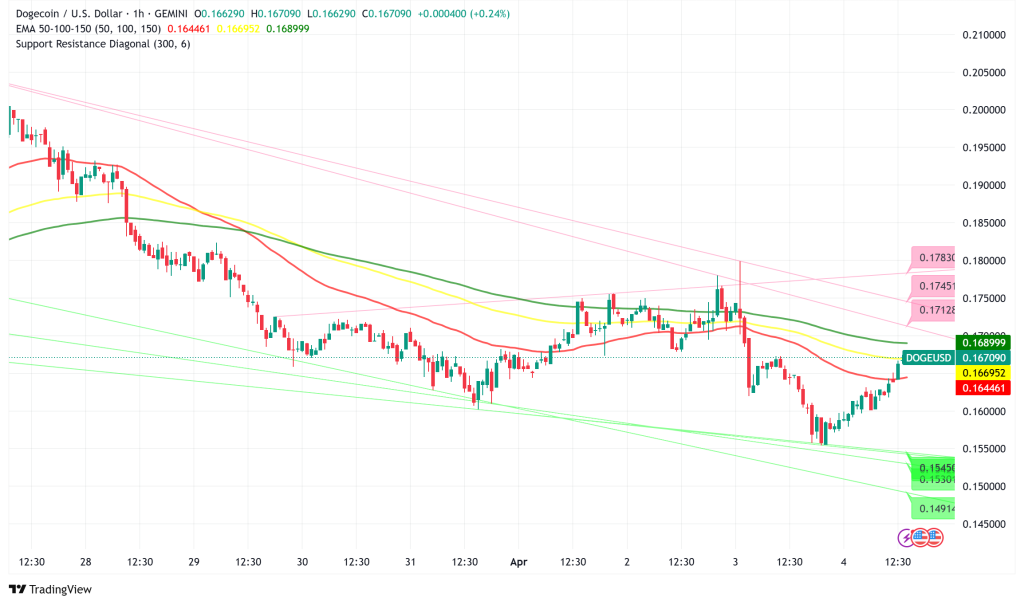
Dogecoin (DOGE), the popular memecoin, is currently holding above the $0.16 support level, up by over 1.4% in the past 24 hours. This modest gain comes after a period of significant volatility that saw the digital asset experience a dramatic 12.7% price range between $0.179 and $0.156.

Dogecoin’s Volatility Spike Puts Traders on Alert
Technical indicators show that DOGE’s 48-hour annualized volatility has jumped to 86.3%, much beyond market standards. A dramatic sell-off starting on April 2nd and lasting until April 3rd was mostly responsible for this increased volatility.
With high-volume selling pressure showing great market uncertainty, market analyst Aayush Jindal writes, “The breakdown of key support at $0.165 established new resistance levels.”
After establishing a temporary bottom at $0.155-$0.156, the bitcoin has been stabilizing under intense observation whether it will recover the crucial $0.165 +/- zone.
DOGE Whale Activity Suggests Growing Confidence
Large “whale” investors have been aggressively accumulating Dogecoin DOGE/USD throughout the most recent price adjustment phase in a maybe positive development. Data published by CoinJournal indicates that last month whale wallets bought almost 220 million DOGE, or $36.08 million.
This significant build-up points to institutional investors and big holdings perhaps setting themselves for a possible recovery despite temporary market volatility. At about $24.4 billion, current market capitalization keeps Dogecoin in eighth place among cryptocurrencies based on market size.
DOGE/USD Technical Analysis: Critical Support-Resistance Levels
The hourly chart analysis reveals several key technical factors that traders should monitor:
- Immediate Support Zones: The $0.158-$0.160 range has emerged as a critical support level, with buyer interest demonstrated by volume spikes (16-21 million) during the recent bottoming process.
- Key Resistance Barriers: The $0.168 level represents the 50% Fibonacci retracement level from the recent decline, while the $0.174 zone serves as major resistance. Breaking above this could open a path toward the $0.180 level that recently rejected price advances.
- Recovery Pattern: A V-shaped recovery pattern has formed from the local bottom, with decreasing selling pressure at resistance levels suggesting potential strength in the current bounce.
Momentum Indicators: The hourly MACD is losing bearish momentum, while the RSI has climbed back above the 50 level, indicating potential short-term bullish sentiment developing.
Dogecoin Price Outlook
Traders will be keenly observing whether the $0.158-$0.160 support zone holds as Dogecoin negotiates this time of increased volatility. With secondary support at $0.132, a drop below $0.155 might set off a more thorough adjustment toward $0.150.
On the other hand, effective defense of current levels and a break over $0.168 could indicate fresh positive momentum, so maybe preparing the ground for a test of the $0.174-$0.180 resistance zone.
Dogecoin Price Prediction
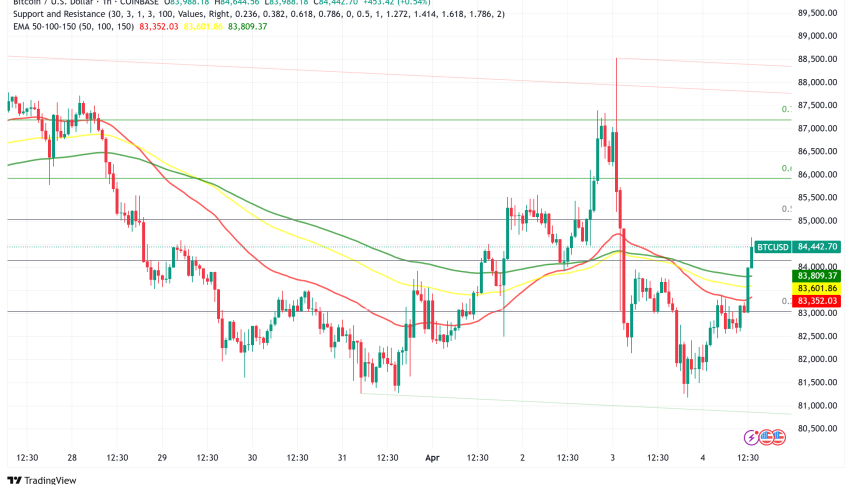
Long-term prospects of Dogecoin still divide market analysts. Although some technical analysts point to the development of more lows on the three-month chart as a possibly positive indication, others warn that the path of Bitcoin still greatly shapes DOGE’s price movement.
“In the $0.22 to $0.25 level, dogecoin is creating a main resistance line. While adding that “the sustainability of Dogecoin’s ascent could be influenced by Bitcoin price patterns, macroeconomic variables, and regulatory difficulties,” one analyst said if it breaks over this range there could be opportunity for an upward trajectory.”
A more hopeful picture results from a recent TradingView study showing a positive divergence between relative strength index (RSI) and price action. The analyst advised Dogecoin supporters to keep a positive attitude despite bad news since she suggested future possibility for fresh highs.


