Despite economic uncertainty, gold’s bullish momentum remains strong. After a brief dip below $3,000, buyers stepped in aggressively, reaffirming support at the 50-day simple moving average (SMA). The announcement of auto tariffs reignited GOLD ’s upward trend, sending XAU/USD above $3,085, further cementing its role as a safe-haven asset. The previously distant $4,000 target now appears increasingly realistic as market instability persists.
btc-usd
Forex Signals Brief April 1: Euro Inflation and US Manufacturing for Fool’s Day
Today we might see some more scattered moves for Fool's Day, ahead of tariffs tomorrow, with Eurozone inflation and US JOLTS jobs...
Skerdian Meta•Tuesday, April 1, 2025•3 min read

Live BTC/USD Chart
BTC/USD

0.0000
MARKETS TREND
Today we might see some more scattered moves for Fool’s Day, ahead of tariffs tomorrow, with Eurozone inflation and US JOLTS jobs in the meantime.

As the U.S. market opened with heightened uncertainty due to upcoming tariffs set to take effect tomorrow, Asian and European stock markets extended their declines from last week, closing lower across the board. The impact of the tariff concerns rippled through global markets, with European indices and Asia-Pacific sessions suffering losses.
Pre-market U.S. futures initially pointed to a steep drop but later recovered some losses after Washington suggested that tariff reductions could be possible if trading partners took steps to address trade imbalances. Despite this, the Nasdaq remained under pressure, finishing the first quarter down 10%, leading the broader market selloff.
Meanwhile, gold prices continued their record-breaking rally, ending the day at a new all-time high of $3,128, as investors sought safe-haven assets amid economic uncertainty. Crude oil also surged, gaining $2 per barrel to close above $71, fueled by escalating geopolitical tensions in Europe and concerns over potential supply disruptions.
Today’s Forex Events
On the economic data front, expectations for inflation and labor market figures remain mixed. The Eurozone CPI year-over-year is forecasted at 2.3%, in line with previous readings, while the U.S. Core CPI Y/Y is anticipated to ease slightly to 2.5% from 2.6%. Last Friday’s weaker-than-expected inflation reports from France and Spain reinforced market expectations of a 25 basis point rate cut in April, with over 70 basis points of easing priced in for the rest of the year.
Meanwhile, the ISM Manufacturing PMI is projected to decline to 49.5 from 50.3, signaling renewed contraction in the sector. The S&P Global survey cited growing concerns over recent policy shifts, with business sentiment at one of the lowest levels in three years, largely due to fears over tariffs and government spending cuts.
Labor market data remains a mixed bag, with U.S. job openings projected at 7.632 million, slightly down from 7.740 million previously. The data suggests that while layoffs remain low and hiring remains steady, finding a job is becoming increasingly difficult. However, as the figures are from January, they do not reflect the latest policy changes from the Trump administration.
The U.S. stock market and the dollar experienced reversals throughout the session, with extreme volatility dominating trading activity. As a result, we executed 37 trading signals this week, with 25 wins and 12 losses, navigating the unpredictable market swings.
Gold Keeps Making Record Highs
XAU/USD – Daily Chart
WTI Oil Price Touches $70 as Ukraine Deal Drags

WTI – Daily Chart
Cryptocurrency Update
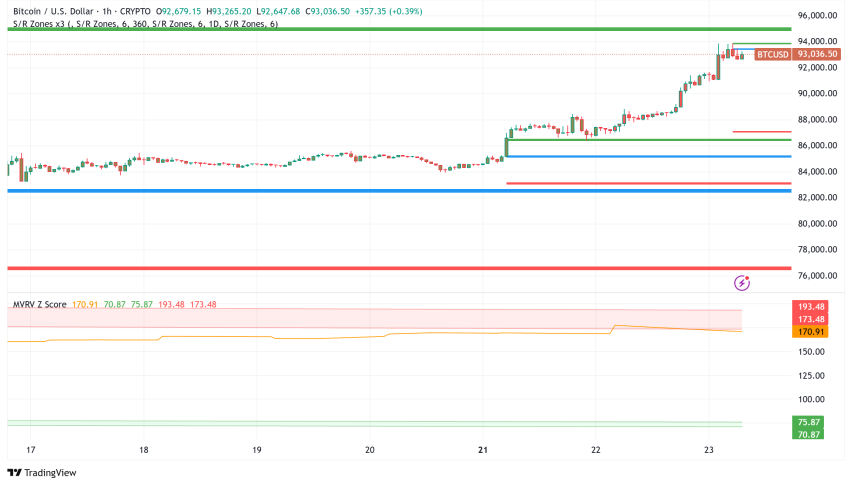
Bitcoin Consolidates Below $90K

BTC/USD – Daily chart
Ripple XRP Remains Subdued by MAs
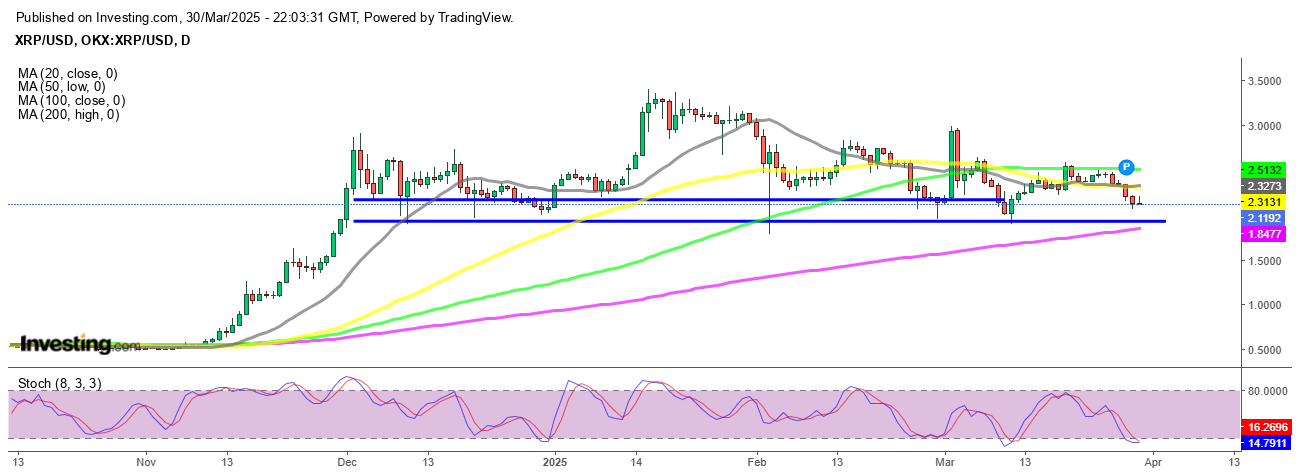
XRP/USD – Daily Chart
- Check out our free forex signals
- Follow the top economic events on FX Leaders economic calendar
- Trade better, discover more Forex Trading Strategies
- Open a FREE Trading Account
ABOUT THE AUTHOR
See More
Skerdian Meta
Lead Analyst
Skerdian Meta Lead Analyst.
Skerdian is a professional Forex trader and a market analyst. He has been actively engaged in market analysis for the past 11 years. Before becoming our head analyst, Skerdian served as a trader and market analyst in Saxo Bank's local branch, Aksioner. Skerdian specialized in experimenting with developing models and hands-on trading. Skerdian has a masters degree in finance and investment.
Related Articles

Comments
Subscribe
Login
Please login to comment
0 Comments
Oldest
Sidebar rates
Related Posts
