Ethereum Bulls Battle to Avert Further Decline Under $1,800 Amid Bearish Signals
Ethereum (ETH) is currently trading around $1,800, marking a decline of over 1.5% in the past 24 hours, as the cryptocurrency struggles to
Live ETH/USD Chart
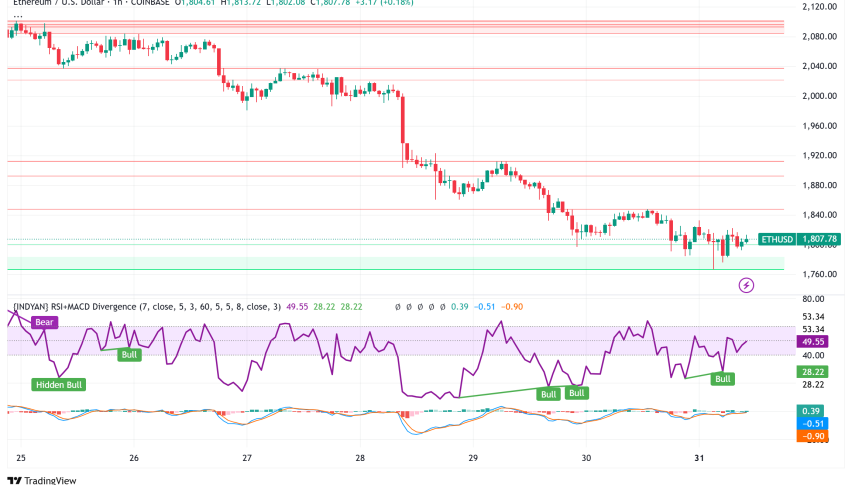
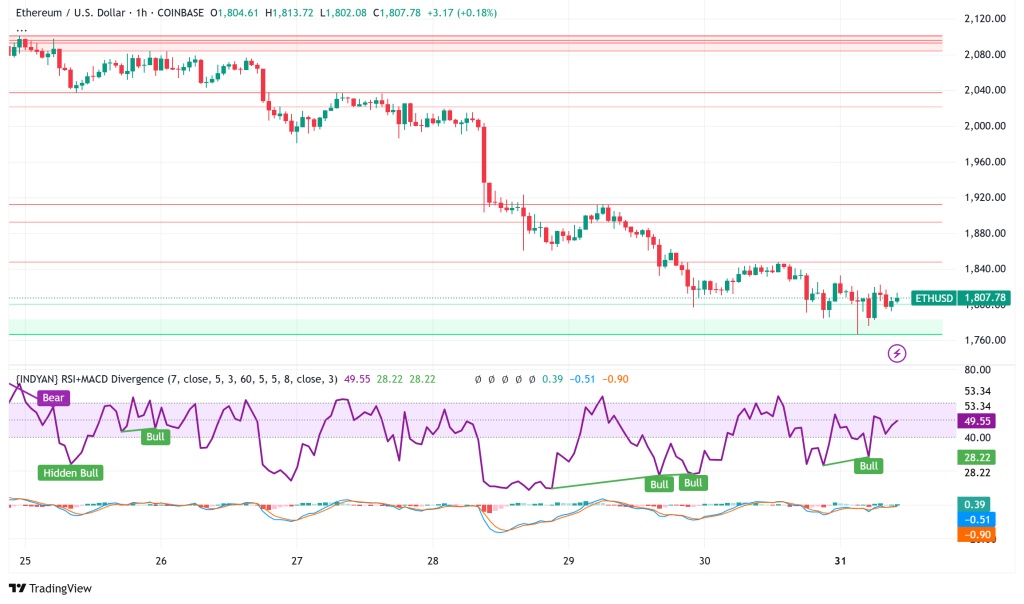
Ethereum (ETH) is currently trading around $1,800, marking a decline of over 1.5% in the past 24 hours, as the cryptocurrency struggles to maintain momentum and faces increasing bearish pressure. After failing to sustain levels above the critical $2,000 resistance, ETH has experienced another dip, raising concerns about a potential major breakdown if bulls fail to establish strong support.
Ethereum Faces Worst Q1 Since 2018, Q2 Recovery Hopes Linger
With a significant drop of -42.47%, Ethereum marks its lowest Q1 performance since 2018 at the end of 2025. This substantial decline has sparked questions about the possibility of a protracted bear market. Historical data, however, points to frequent second quarter noteworthy comeback following poor Q1 performance.
For Ethereum, Q2 has often produced a 66.84% return. Improved market liquidity, rising acceptance of distributed finance (DeFi), and Bitcoin’s post-halved patterns could help to signal a possible Q2 2025 rebound. Furthermore growing are layer-2 solutions like as Arbitrum and Optimism, which could increase transaction demand and network activity.
ETH/USD Technical Analysis Reveals Bearish Trend with Key Resistance at $1,820 and $1,880
Ethereum has dropped below the $1,920 and $1,880 support levels after failing to clearly top the $2,000 barrier. ETH meets instant opposition at a connecting negative trend line forming around $1,820 on the hourly chart of ETH/USD (data via Kraken), trading below $1,880 and with a 100-hour Simple Moving Average (SMA).
At $1,880, a second notable resistance level also corresponds with the 50% Fibonacci retracing level of the current drop from the $2,033 swing high to the $1,671 low. ETH needs to clear both the $1,820 and $1,880 resistance levels if it is to start a significant upward movement, maybe aiming at the $1,920 and finally the $2,000 resistance zones.
Potential for Further Downside if $1,765 Support Fails
Should Ethereum fail to break through the $1,880 barrier, technical study points to another fall-off. Starting on the negative side, initial support is over $1,780; a more important support zone spans $1,6565. Under a more bearish scenario, towards $1,680 and $1,650 in the immediate term, a clear break below this $1,65 may set off additional losses and could drive the price towards the $1,420 support. Both the hourly Relative Strength Index (RSI) below the 50 zone and the hourly Moving Average Convergence Divergence (MACD) losing momentum in the negative zone signal declining bullish momentum.
Analysis of Weekly and Daily Trends Suggests Continued Weakness
Ethereum’s Weekly Chart reveals a quite long bearish candle engulfing the previous week’s bullish candle, thereby indicating a weak trend. The weekly Moving Average 30 (MA30) is still heading down, and although the price is oversold, given the general weakness, a substantial rebound seems improbable in the near run. The weekly MACD reveals a twisted trend below the zero line, therefore emphasizing even more the lack of significant momentum. This study also implies that Ethereum might follow if Bitcoin declines to test the $77,000 support, hence possibly testing levels around $1,500.
The daily chart shows a modest bearish candle in a doji star form along with a downward trend daily MA30. The daily MACD is near to creating a bearish death cross and displays declining increasing momentum. With the $1,500 area noted as a possible short-term support, this six-day bearish run at the daily level points to a continuous test of lesser levels. On the other hand, a positive daily close that stops the MACD death cross could indicate an undetectable divergence pattern, therefore indicating a rebound into the $2,120-$2,320 zone before yet another downfall.
Liquidation Heatmap Reveals Key Price Zones
Liquidation heat map data shows that a price increase could cause a notable amount of short positions in the $1,840-$1,996 zone to be liquidated. On the other hand, a price decline might set off liquidations of long positions in the $1,764-$1,732 zone, therefore emphasizing them as possible very volatile zones.
- Check out our free forex signals
- Follow the top economic events on FX Leaders economic calendar
- Trade better, discover more Forex Trading Strategies
- Open a FREE Trading Account

