Higher PCE Inflation and Tariffs Weigh on S&P 500, Boost Gold Price Toward $4,100?
Several factors are keeping risk sentiment off, which benefits Gold, hence the march toward $4,100, while S&P should keep falling next week.

Several factors are keeping risk sentiment off, which benefits Gold, hence the march toward $4,100, while S&P should continue lower next week.

Gold continues to climb relentlessly, with the $3,100 milestone now within reach, fueled by a mix of economic uncertainty, inflation fears, and global trade tensions. The metal has gained nearly 200% since late 2022, consistently setting fresh record highs. With gold’s momentum showing no signs of slowing, some analysts are now considering the possibility of $4,000 per ounce by the end of 2025, a target that seemed unlikely just a few months ago.
Gold Chart Daily – XAU Rally Shows No Signs of Slowing
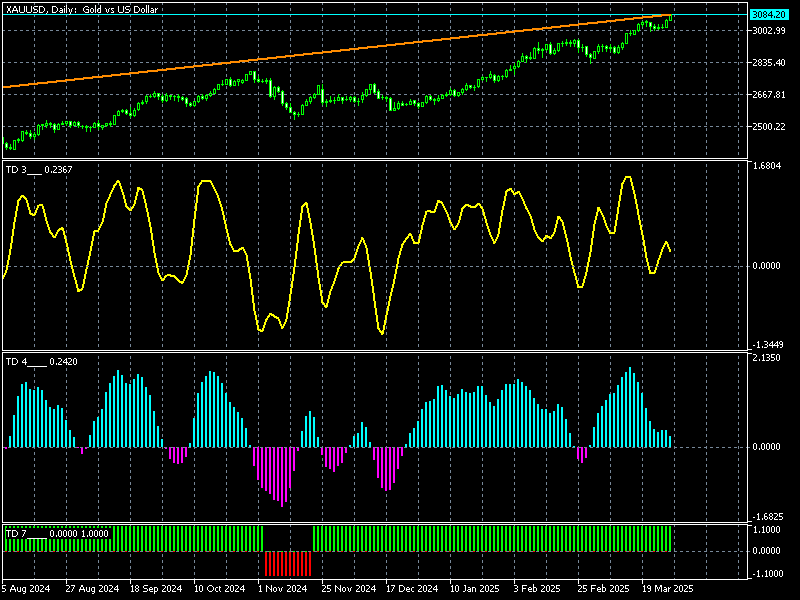
Gold prices opened above $3,000 on Monday and surged to a new record of $3,086.77 on Friday, closing near its highs. Renewed concerns over U.S. tariffs set to take effect on April 2 have added to safe-haven demand, reinforcing the bullish trend. Technical indicators remain overwhelmingly positive, with two strong bullish candlesticks on the daily chart confirming sustained buying momentum.
Even Bank of America (BofA) has revised its gold price forecasts upward, citing short-term pricing pressures from uncertainty around U.S. trade policy. In a report released Wednesday, BofA now expects gold to reach $3,063 per ounce in 2025 and $3,350 in 2026, significantly above their previous estimates of $2,750 and $2,625, respectively.
US PCE Inflation Rises More Than Expected, Pressuring Markets
S&P Down on Inflation and Tariff Worries
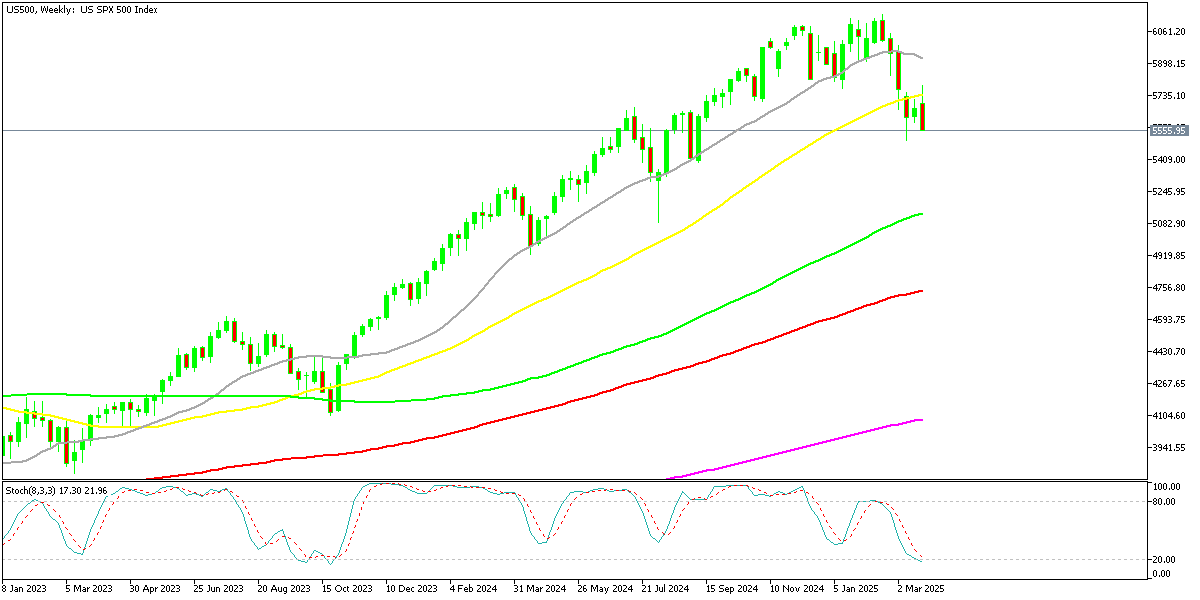
While gold shines, the stock market has turned increasingly bearish. The S&P 500 tumbled more than 3% this week, closing at 5,580.94 points, down 137.14 points (-2.70%). This decline came despite positive developments, including Trump’s efforts to ease trade tensions with Canada and the EU offering trade concessions on Friday.
One of the key drivers behind the selloff was higher-than-expected PCE inflation, which may give the Federal Reserve more reason to delay interest rate cuts, further pressuring equities. Investors are particularly focused on consumer spending trends, with services spending rising just 0.2%, the slowest pace since August 2023.
Major Stock Indexes Close Sharply Lower Amid Market Selloff
Key Index Performances:
S&P 500 ended the session at 5,580.94 points, declining by -137.14 points (-2.40%), as investors reacted to growing concerns over economic uncertainty and inflation data.
Nasdaq Composite saw the steepest drop, closing at 17,322.99 points, down -723.19 points (-4.01%), weighed down by heavy losses in technology and AI-related stocks.
Dow Jones Industrial Average settled at 41,583.90 points, shedding -596.24 points (-1.41%), with blue-chip stocks under pressure from weaker corporate earnings.
Russell 2000 Index, which tracks small-cap stocks, declined to 2,023.27 points, losing -52.20 points (-2.52%), signaling broad market weakness beyond large-cap firms.
Toronto S&P/TSX Composite Index in Canada closed at 24,759.15 points, down -301.06 points (-1.20%), as energy and financial sectors also faced selling pressure.
This sharp downturn reflects heightened volatility across financial markets, fueled by concerns over inflation, interest rate uncertainty, and a fading AI-driven rally. The Nasdaq’s deep decline suggests a significant pullback in the tech sector, while the S&P 500 and Dow Jones also suffered amid risk-off sentiment. If bearish momentum continues, investors may shift further toward defensive assets such as gold and bonds in the coming sessions.
Federal Reserve Faces Inflation Dilemma
The Fed now faces a growing concern: February’s core PCE inflation reading of +0.38% m/m suggests that elevated inflation levels could persist for the rest of the year. At this pace, core inflation would equate to 4.66% annually, far exceeding the Fed’s 2% target. Even when factoring in January and February, core inflation is still running at 4.06%, making rate cuts increasingly difficult to justify.
While the bond market has remained relatively calm, Musalem’s announcement of potential rate hikes this week could create further instability. If inflation remains sticky and tariffs add to economic uncertainty, gold may continue its parabolic rise, while stocks remain under pressure.
Gold Live Chart
- Check out our free forex signals
- Follow the top economic events on FX Leaders economic calendar
- Trade better, discover more Forex Trading Strategies
- Open a FREE Trading Account
Related Articles

Comments
Sidebar rates
Related Posts
