ETH Price Drops Below $1,900: Over $92M Liquidated in Sudden Crash
Ethereum (ETH) has tumbled sharply, posting a 5.32% drop and decisively breaking below the key $2,000 support.

At the time of writing, ETH trades at $1,884, signaling a significant shift in market sentiment. This plunge comes while most other major cryptocurrencies remain relatively stable, prompting renewed speculation around ETH-specific catalysts.
U.S. Government ETH Transfer Fuels Speculation
Adding a twist to the narrative, the U.S. government moved 884 ETH earlier this week. While some initially linked this activity to the price drop, the market reaction came nearly 13 hours later—indicating that other forces likely drove the decline. Still, the 24-hour trading volume has spiked 9%, underscoring elevated activity as traders digest the volatility.
ETH Tops Liquidation Charts With $92M in Losses
Ethereum’s breakdown has sent shockwaves through the derivatives market:
Over $92 million in long and short ETH positions were liquidated
Long traders bore the brunt of losses due to the sudden downside break
The pattern reflects panic selling and cascading stop-outs, characteristic of leveraged markets in stress
This wave of liquidations serves as a reminder of the inherent risks in margin trading, especially in a high-volatility environment.
Why Did ETH Crash? Traders Eye Institutional Moves, Liquidity Gaps
Analysts and traders remain split on the exact causes of ETH’s sharp correction. Key points under debate include:
Institutional Sell-Off: Some suspect a large-scale ETH dump, possibly by a whale or fund, during low-liquidity Asian trading hours.
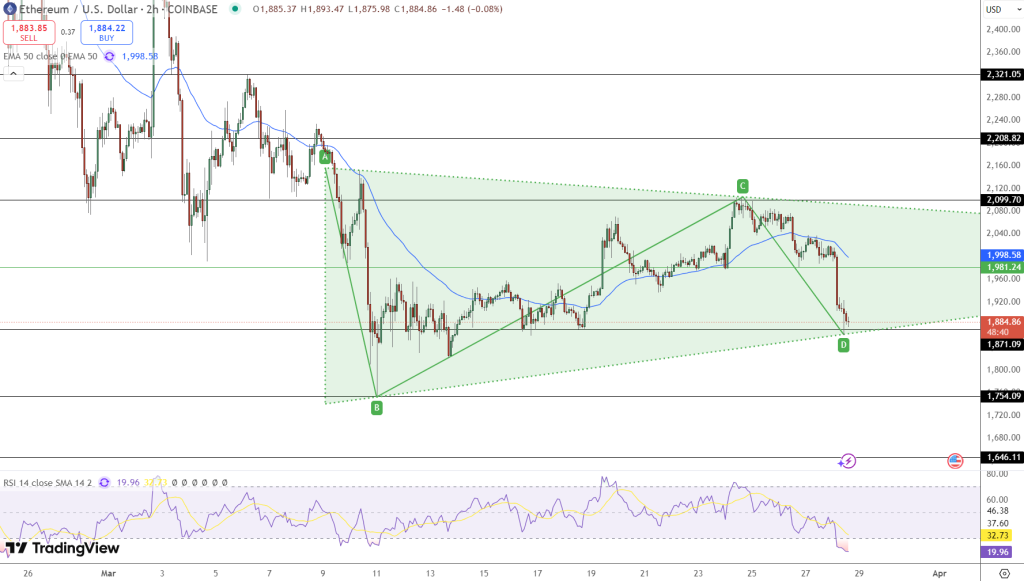
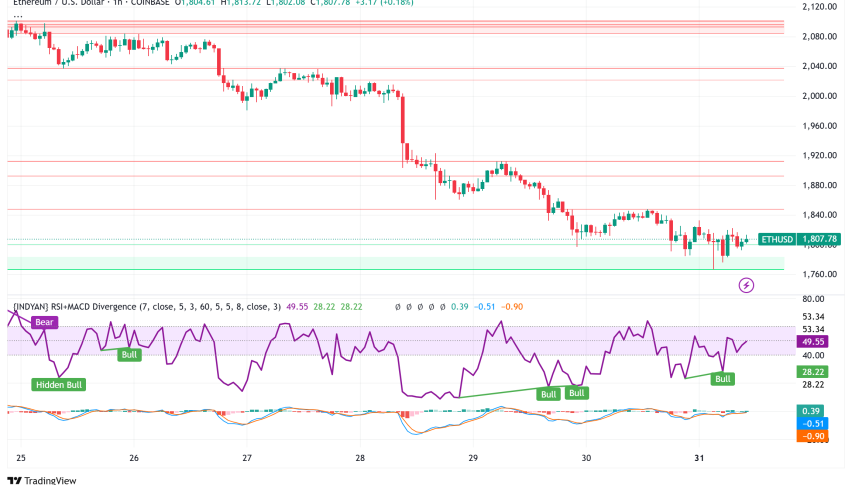
Technical Breakdown: ETH failed to hold the rising wedge pattern, breaking below support near $1,981 and targeting the lower boundary around $1,871.
Market Underperformance: Ethereum continues to underperform Bitcoin and altcoins in relative strength, adding to bearish pressure.
Liquidity Vacuum: The RSI has plunged to 19.96, signaling extremely oversold conditions, but also highlighting how thin liquidity zones can amplify moves.
What’s Next for Ethereum?
The key short-term level to watch is $1,871, a lower trendline that could act as support in the immediate term. If this level fails, ETH may retest the February lows near $1,754. On the upside, a recovery above the 50-EMA at $1,998 would be essential to regain bullish momentum.
For now, sentiment remains fragile, and ETH holders are closely monitoring whether this dip marks the start of a deeper correction or simply a volatile flush-out before a recovery.


Sidebar rates
Related Posts
