
Gold prices remain on an upward trajectory despite mixed economic indicators. While a $4,000 price target once seemed unrealistic, XAU/USD reaching $3,057 on Wednesday has made this scenario increasingly plausible. A temporary drop close to $3,000 triggered a buy signal, which was quickly validated as gold bounced off the 50-day simple moving average (SMA), a key technical support level. Yesterday the bullish momentum resumed after auto tariffs, which sent XAU above $2,060.
btc-usd
Forex Signals Brief March 28: Hot PCE Inflation Could Sink Stock Markets Before Weekend
Skerdian Meta•Friday, March 28, 2025•3 min read
Today a strong PCE inflation reading would add to tariff worries before the weekend, sending stock markets lower.

A significant portion of the market had anticipated a sharp rise in initial unemployment claims, but that did not materialize today. However, the U.S. trade deficit remained near record levels, which is expected to weigh on GDP.
Minor gains in the British pound and euro, driven by trade flows, were short-lived, with both currencies erasing their 25-pip advances quickly. Meanwhile, the U.S. dollar remained under pressure as market sentiment toward tariffs shifted. The ongoing global uncertainty continues to push investors toward safe-haven assets, fueling gold’s upward momentum.
Since Trump overtook Biden in the polls last year, gold prices have surged dramatically, with another strong increase today. A brief period of profit-taking led to a quick $25 pullback, but buyers quickly stepped in, propelling gold to fresh highs of $5,059.
Heading into the trading session, stock market sentiment was cautious, with U.S. equities initially falling at the open. However, as weaker hands were shaken out, signs of easing trade tensions emerged, helping to stabilize market sentiment. AI-related stocks also saw renewed pressure as concerns about the sustainability of the AI boom resurfaced.
Today’s Forex Events
Eyes will be on CoreWeave’s IPO later today. However, early this morning in Tokyo, inflation data showed that February’s headline CPI increased by 2.9% year-over-year, slightly above the 2.7% forecast but steady from January’s figure. Core CPI, excluding fresh food, came in at 2.4% annually, matching expectations. The measure excluding both fresh food and energy rose to 2.2% year-over-year, slightly above the 2.0% projection and the previous reading of 1.9%.
In the U.S., the Personal Consumption Expenditures (PCE) index, the Federal Reserve’s preferred inflation gauge, is projected to show an annual increase of 2.5%, unchanged from the previous year. The month-over-month reading is expected at 0.3%. Core PCE, which excludes food and energy, is anticipated to rise by 2.7% year-over-year, slightly higher than the previous 2.6% print, with the monthly figure also estimated at 0.3%. Since forecasters typically use CPI and PPI data to estimate PCE, the market has already priced in expectations, and any major deviation from forecasts would be required to shift sentiment.
Last week the volatility was high, but there were quite a few reversals as well, as the USD started to make a comeback after crashing down for several weeks. We opened many trading signals as a result, 43 in total, ending the week with 24 winning signals and 19 losing ones.
Gold Keeps Making Record Highs
XAU/USD – Daily Chart
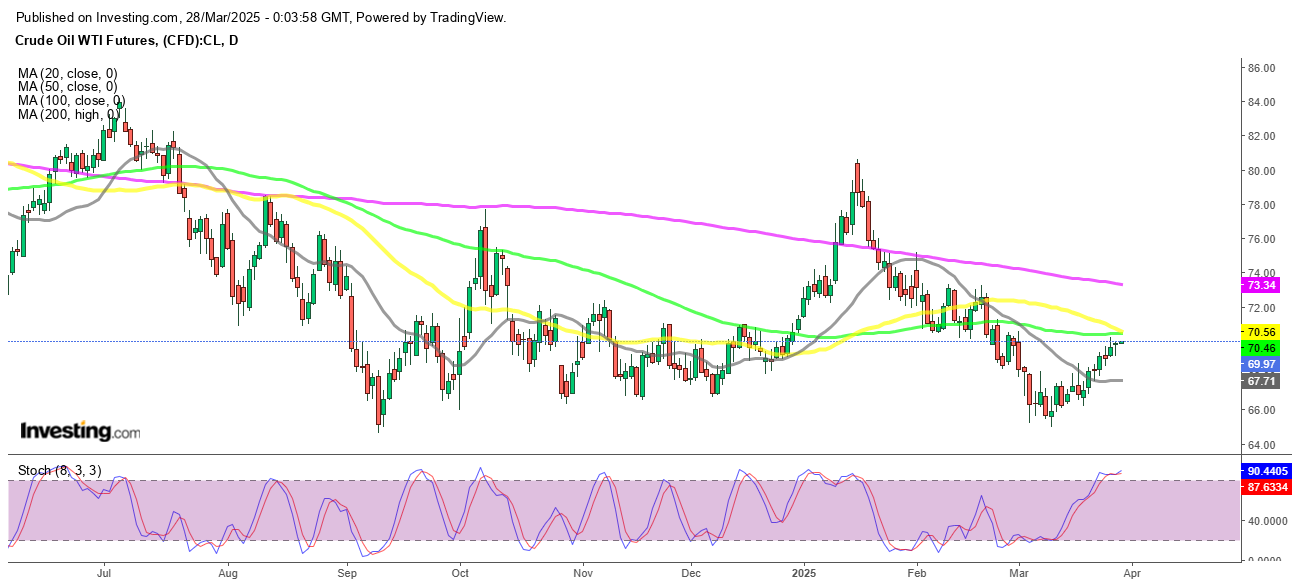
WTI Oil Price Touches $70 as Ukraine Deal Drags
USD/JPY – Weekly Chart
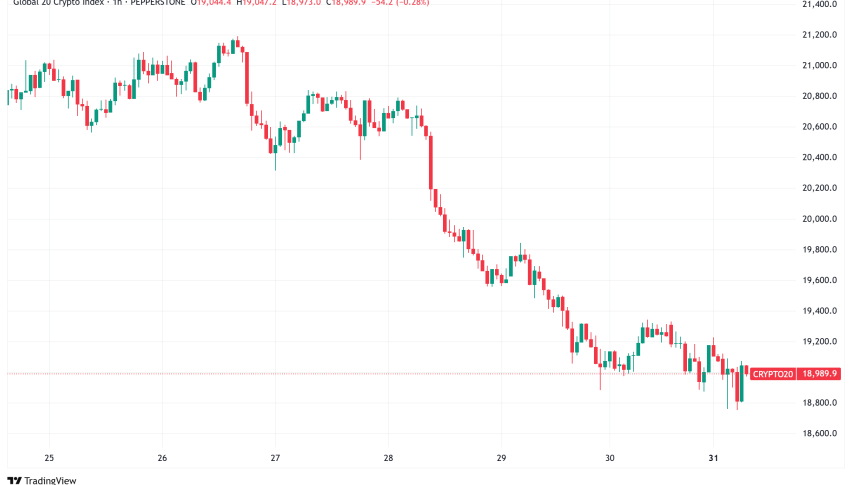
Cryptocurrency Update
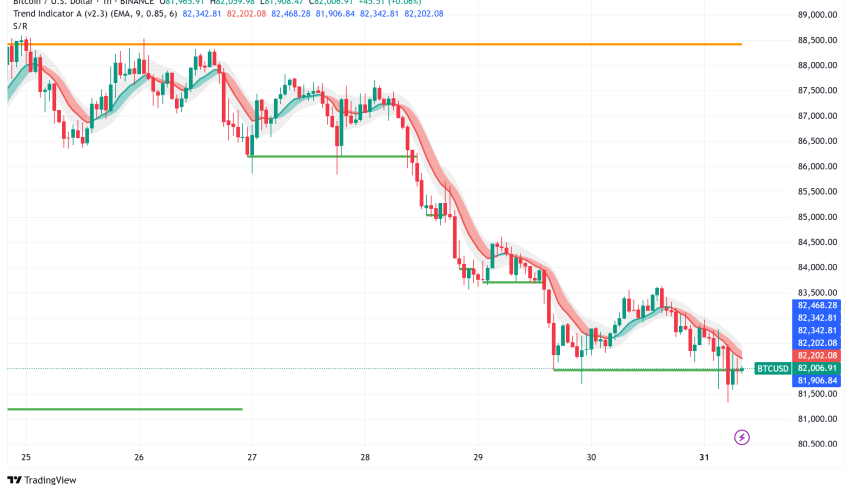
Bitcoin Consolidates Below $90K
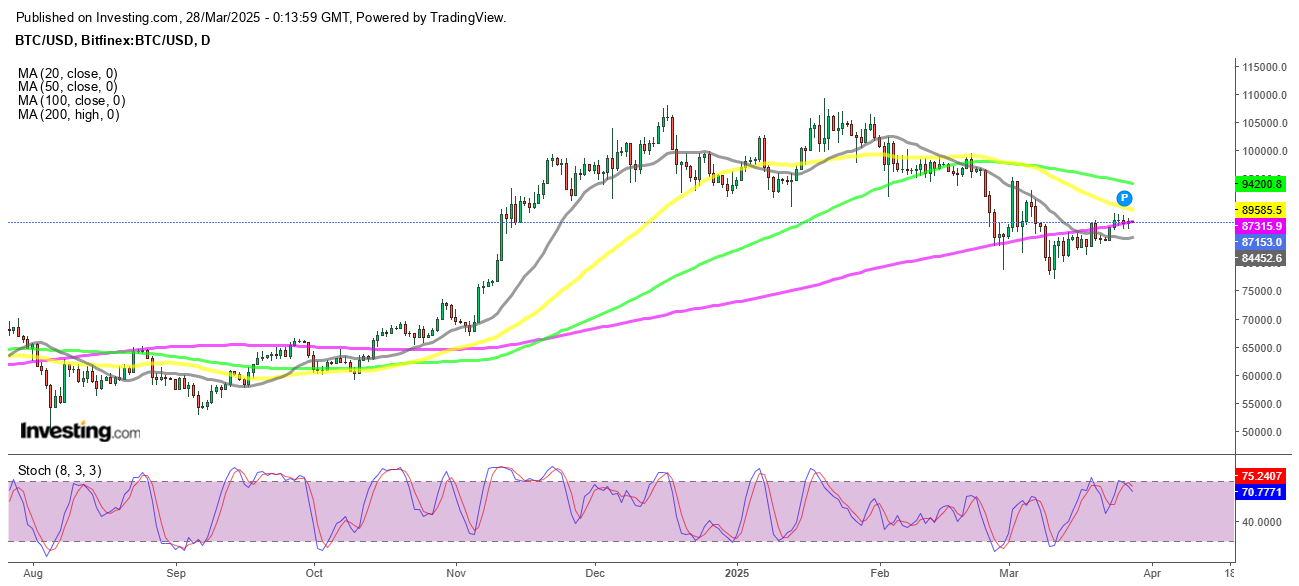
BTC/USD – Daily chart
Ripple XRP Remains Subdued by MAs
Ripple (XRP) also experienced a surge after CEO Brad Garlinghouse announced the long-standing SEC lawsuit against the company had finally been resolved. This news briefly pushed XRP above $2.58, challenging resistance at the 50-day SMA. However, buyers struggled to sustain the rally, leading to a pullback below $2.50 by the session’s close. Despite the dip, Ripple remains the third-largest cryptocurrency with a market capitalization of $146 billion.
XRP/USD – Daily Chart
Check out our free forex signals
Follow the top economic events on FX Leaders economic calendar
Trade better, discover more Forex Trading Strategies
Skerdian Meta
Lead Analyst
Skerdian Meta Lead Analyst.
Skerdian is a professional Forex trader and a market analyst. He has been actively engaged in market analysis for the past 11 years. Before becoming our head analyst, Skerdian served as a trader and market analyst in Saxo Bank's local branch, Aksioner. Skerdian specialized in experimenting with developing models and hands-on trading. Skerdian has a masters degree in finance and investment.
Related Articles

Comments
Subscribe
Login
Please login to comment
0 Comments
Oldest
Sidebar rates
Related Posts
