Ethereum Risks Drop to $1.2K as Bear Flag Emerges Amid End of ETH Supply Deflation

Ethereum’s price is teetering above $2,000, facing significant bearish pressure as a prominent bear flag pattern forms on the daily chart, coinciding with diminishing network activity and a return to ETH supply inflation, potentially paving the way for a steep decline towards $1,200. This bearish technical setup is occurring despite news of increasing institutional adoption through the launch of bank-issued stablecoins on the network.
Bear Flag Formation on Daily Chart Signals Potential 40% Price Plunge
Ether’s ETH/USD price action over the past month has culminated in the formation of a clear bear flag pattern on the daily chart. Usually following a dramatic downward movement (the flagpole) and a consequent period of consolidation, this is a bearish continuation pattern.
A confirmed breakdown below the bottom threshold of this flag—currently around the $2,000 mark—would indicate the beginning of a significant downslide. Measuring the height of the original flagpole, which indicates toward a possible price of nearly $1,230, which represents a roughly 40% reduction from current prices, helps one forecast the objective for this breakdown.
Slumping Network Activity and All-Time Low Transaction Fees Indicate Weak Demand
Furthermore supporting the bearish technical view are alarming onchain statistics. Daily transaction count for Ethereum has dropped to levels not seen in October 2024 before to the US presidential contest. More shockingly still, on March 24th the average transaction fees on the Ethereum network dropped to an all-time low of just $0.46 (0.00025 ETH).
Low transaction counts and fees point to a notable decline in demand for block space—for decentralized finance (DeFi), non-fungible tokens (NFTs), or other decentralized apps (DApps). Historically, this lower network activity has been associated with declining investor interest and market confidence, therefore undercutting Ether’s price.
Ethereum Supply Inflation Returns, Reversing Post-Merge Deflationary Trend
The reintroduction of inflation to the Ethereum supply is a main element fueling the pessimistic attitude. Daily ETH burn rate has dropped to all-time lows as transaction fees fall. The expected ETH burn rate has thus dropped dramatically, resulting in an annual ETH supply increase of 0.76%, or around 945,000 additional ETH released annually.
This flips the deflationary era started following the successful September 2022 Proof-of- Stake (the Merge) switch when some transaction fees were burned were burned. Ethereum’s whole supply now exceeds pre-Merge levels, therefore negating a major positive narrative about the asset’s scarcity.
Bank-Issued Stablecoin Launch Offers Glimmer of Institutional Adoption
Though the price picture is gloomy, the Ethereum network is clearly being adopted institutionally. Recently on the Ethereum blockchain, Custodia Bank in cooperation with Vantage Bank debuted America’s first-ever bank-issued stablecoin.
Using Ethereum’s infrastructure for low-cost, quick, auditable transactions inside a controlled banking environment will help to transform the payment system in the area. This release emphasizes, despite pricing challenges, the continuing value and acceptance of the Ethereum network.
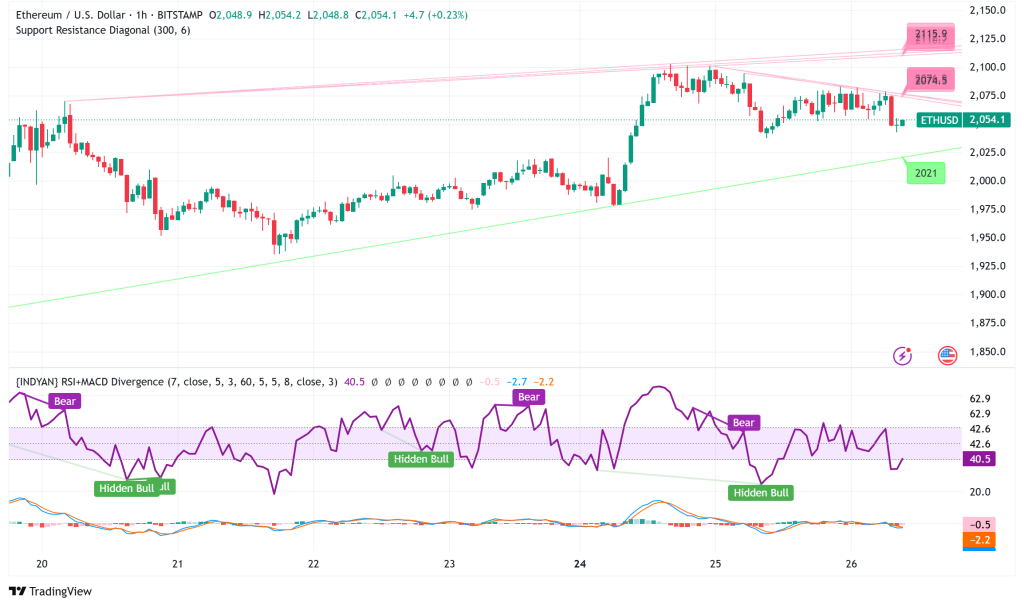
ETH/USD Technical Analysis: Key Support at $2,000 Under Scrutiny
The lower trendline of the bear flag, which falls around $2,000, shows the immediate support level to observe. A clear daily candlestick close below this level would probably confirm the bearish breakdown and set off the expected movement toward the $1,230 target.
While some experts remain hopeful, implying a possible comeback above the $2,200 barrier might invalidate the bearish setup, the general technical and onchain data presents a worrying picture for Ether’s short-term price movement.
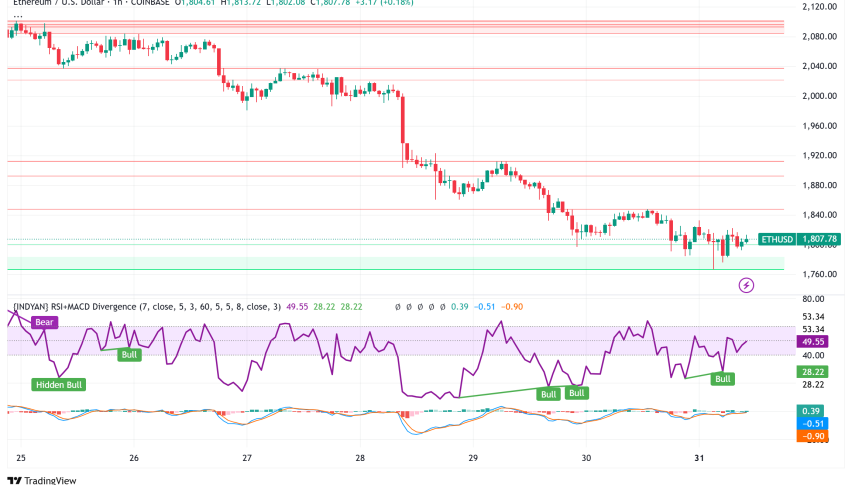
Contrasting Bullish Technical Outlook Suggests Potential Rebound to $2,300
Unlike the bear flag study, some technical viewpoints point to a possibility for a rebound. Rising positive momentum shown by the MACD combined with a recent break from a long-dated declining price channel on the daily chart could signify the start of a trend reversal. ETH may swiftly climb towards the $2,300 mark if this upward momentum keeps on, providing a considerable increase from present values.
Ethereum Price Prediction: Standard Chartered Sees Long-Term Potential
Standard Chartered analysts have admitted that Ethereum’s price movement is erratic and linked recent dips to less on-chain activity, poor governance, and more competition from other blockchains. Although they caution that Ethereum’s reliance on layer-2 solutions could be compromising its base-layer value, they remain hopeful about its long-term future and believe ETH could reach $3,000 in 2025 should governance and scalability issues be properly solved.

Sidebar rates
Related Posts
