Solana (SOL) Tests $140 Amid ETF Hopes and Bullish Technical Breakout
Solana's native token, SOL, has experienced a significant rally, currently holding just under $140, up by over 1% in the last 24 hours. This
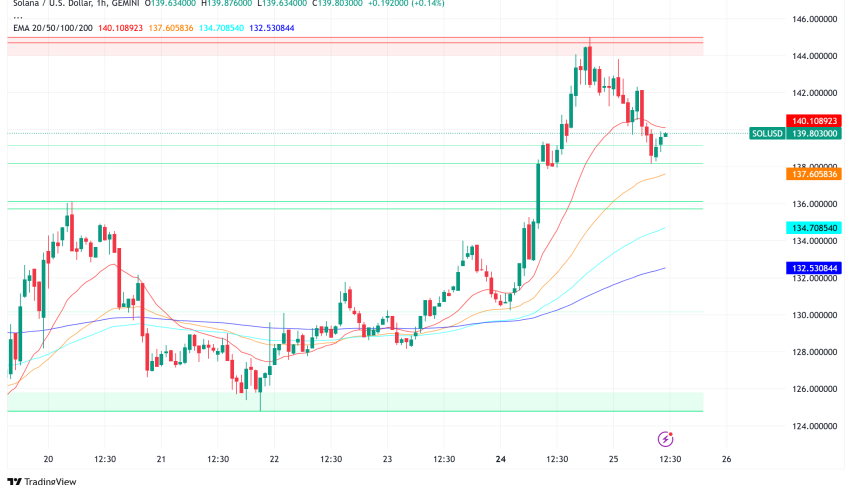
Live SOL/USD Chart

Solana’s native token, SOL, has experienced a significant rally, currently holding just under $140, up by over 1% in the last 24 hours. This follows a substantial 8.5% gain on March 24th, which saw SOL reclaim the $142 mark for the first time in two weeks.

SOL/USD price recovery is being driven by a combination of factors, including broader market optimism, increased network activity on the Solana blockchain, growing institutional interest as evidenced by Fidelity’s recent move, and positive technical indicators suggesting further upside potential.
Fidelity Investments Files for Solana Fund, Paving the Way for Potential ETF
In a major development signaling growing institutional confidence in Solana, asset management giant Fidelity Investments has filed for the “Fidelity Solana Fund.” Like the current Bitcoin and Ethereum ETFs, this application with the CSC Delaware Trust Company is a vital first step toward maybe providing Solana with a regulated investment product. Should accepted, this fund would give institutional and retail investors a more easily available and regulated means of exposure to Solana, hence fostering possibly higher adoption and money flow into the Solana ecosystem. Fidelity’s action emphasizes the growing need for several crypto investing options beyond the two industry giants.
Solana Network Activity and Fundamentals Show Strength
Solana’s underlying principles are robust even if it underperforms in relation to the larger crypto market. In terms of Total Value Locked (TVL), it ranks second among all the blockchains; onchain volumes place it third. Especially, Solana’s network fees have now exceeded those of the Ethereum base layer, rising in two weeks and signifying a notable rise in network activity and income. Solana also presents a pleasing native staking reward rate of 7.7%, more than its inflation rate.
Polymarket Integration Further Boosts Solana’s Ecosystem
Adding to the encouraging news is Solana for wallet deposits incorporated into Polymarket, a well-known blockchain-based prediction market. Solana’s fast and low-fee transactions mean that this measure is meant to lower transaction costs and enhance platform user experience, hence maybe drawing more users.
SOL/USD Technical Analysis: SOL Breaks Ascending Triangle on Daily Chart, Targeting $170
Examining the technical charts, Solana shows a bullish breakthrough pattern. SOL has broken over a significant resistance level around $137 on the daily chart, which had earlier indicated a spell of consolidation following earlier March falls. This breakout corresponds with the development and later breach of an ascending triangle pattern.
Based on this triangle’s height, experts predict Solana’s short-term price objective at roughly $170. This aim indicates a likely complete reversal of the recent downturn and a great possibility for more increases in the next days and weeks.
Stronger indication that a local bottom has been established and bulls are firmly under control would come from a confirmed movement over the $180 level, though.
Hourly Chart Shows Key Resistance Turned Support, RSI Signals Overbought Conditions
Solana has also broken over another important resistance level at $140 on the hourly chart; this is currently anticipated to be a support level during any possible short-term pullbacks. On the hourly basis, nevertheless, the Relative Strength Index (RSI) is currently approaching the 80 mark, suggesting that SOL is rather overbought in the immediate run.
This implies that before the price moves further notable increase, a minor retreat or consolidation phase may take place. On the hourly chart, one should keep an eye on a major support level around $137.
Golden Cross Formation on EMA Lines Reinforces Bullish Outlook
Complementing the good technical signs, Solana’s Exponential Moving Average (EMA) lines have lately produced a golden cross. Often indicating the possibility for a continuous uptrend, this is a positive indication when the shorter-term moving average—e.g., the 50-day EMA—crosses above the longer-term moving average—e.g., the 200-day EMA.
Key Resistance and Support Levels to Watch
Investors and traders should monitor important resistance levels very closely. The immediate opposition to view is about $152.90. Should Solana be able to surpass this level, the $180 mark would become the next major goal. On the down side, the main support level to keep an eye on is about $136.71.
With possible support at $120 and then $112 should selling pressure rise, a break below this level could result in more negative impact.
Top Traders on Binance Show Increased Bullish Sentiment
Top traders on Binance have dramatically raised their leveraged long (buy) positions on SOL, according data from CoinGlass. On March 23rd, the long-to-short ratio among these traders skyrocketed to its greatest level in more than two months, signifying great bullish attitude and faith in Solana’s capacity for additional price increase.
Solana Price Prediction: $170 Next Target?
Solana is currently demonstrating strong recovery momentum, driven by a confluence of positive factors. The potential for a spot Solana ETF, highlighted by Fidelity’s fund filing, is generating significant excitement. Coupled with increasing network activity, strong fundamentals, bullish positioning from top traders, and positive technical indicators pointing towards a $170 target, Solana appears well-positioned for continued growth. While short-term overbought conditions might lead to a temporary pullback, the overall outlook for SOL remains optimistic, with key resistance levels being the next hurdles to overcome.
- Check out our free forex signals
- Follow the top economic events on FX Leaders economic calendar
- Trade better, discover more Forex Trading Strategies
- Open a FREE Trading Account
Related Articles
Comments
Sidebar rates
Related Posts
