Nasdaq (IXIC) Enters Steep Correction, Reaches Critical Support Level
Konstantin Kaiser•Tuesday, March 25, 2025•2 min read

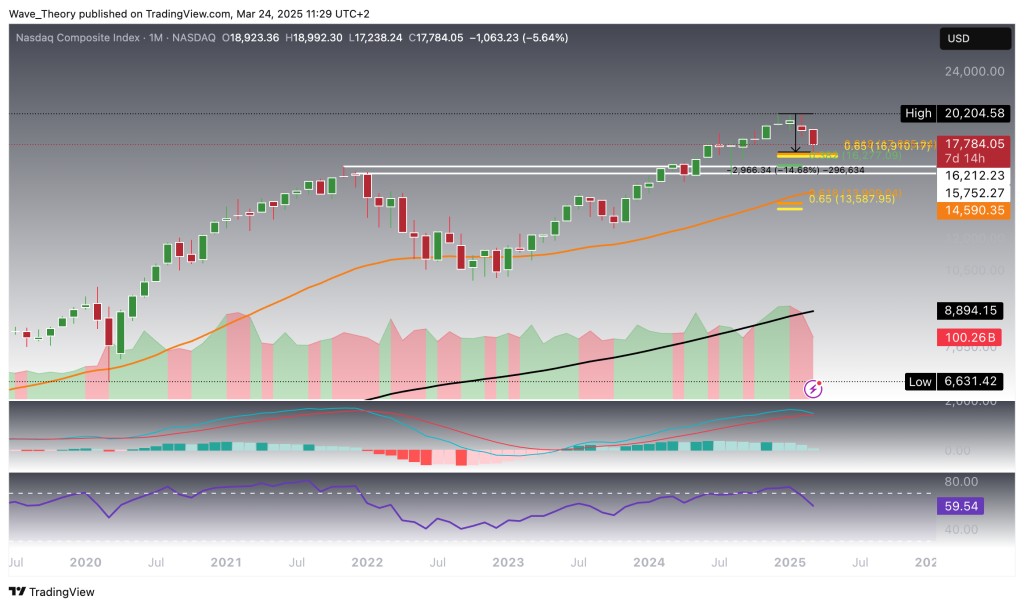
Nasdaq (IXIC) has undergone a 15% correction over the past two months, now finding itself at a crucial Fibonacci golden ratio support level of 17,200, where a potential bullish reversal could take shape.
Technical Indicators and Trends (Monthly Chart):
- MACD: The MACD lines are nearing a bearish crossover, with the histogram showing consistent bearish momentum for the past four months.
- RSI: The RSI has pulled back from overbought territory to neutral, reflecting the reduced buying pressure.
- EMA: Despite the correction, the EMAs remain in a golden crossover, suggesting the long-term trend remains bullish.
With key indicators still favoring the bullish side, Nasdaq could be poised to resume its uptrend after completing its current correction phase.
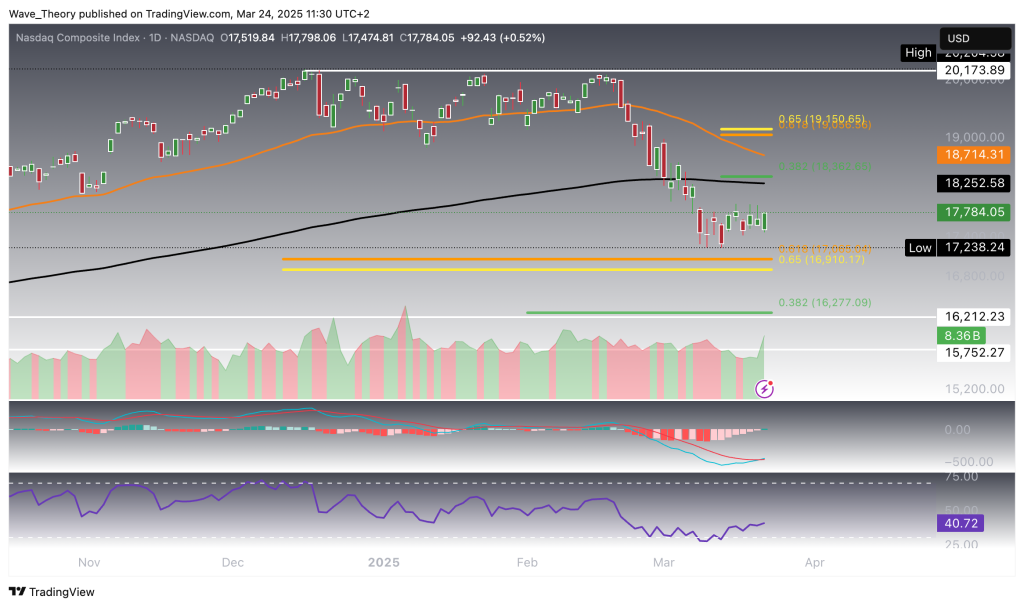
Nasdaq Composite Index (IXIC): Bullish Signals On The Daily Chart
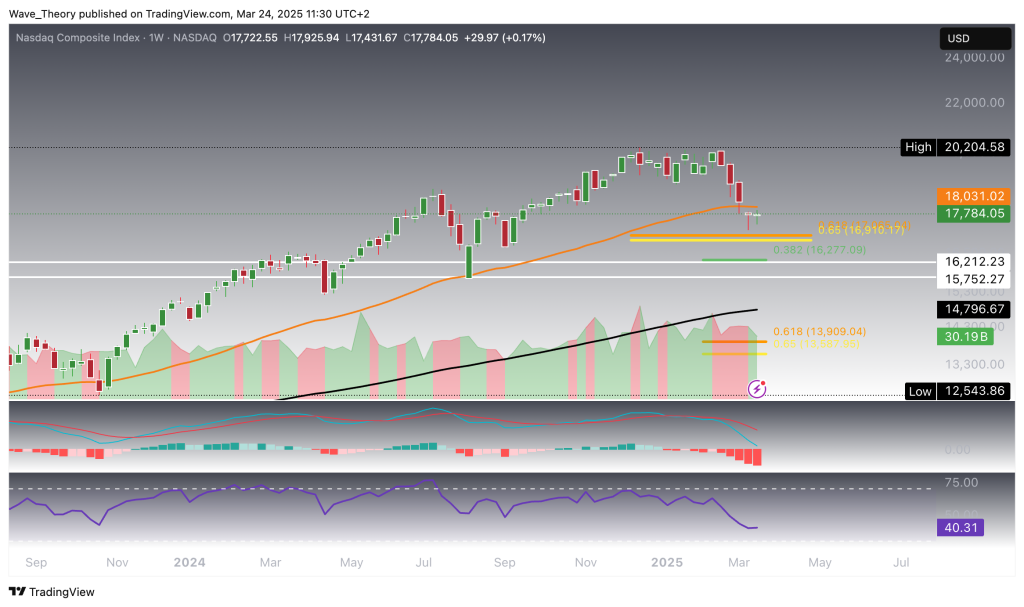
If the Nasdaq Composite Index (IXIC) continues its upward momentum, the next significant Fibonacci resistance levels are at 18,363 and 19,150. A break above the golden ratio at 19,150 is crucial for Nasdaq to resume its long-term uptrend, which could then lead IXIC to target its previous high of 20,205—an area where it has faced multiple rejections in the past.
- MACD: The MACD lines are on the verge of a bullish crossover, with the histogram trending upward for the past week, signaling growing bullish momentum.
- RSI: The RSI is oscillating in neutral territory, providing no definitive bias for the moment.
- EMAs: Although the EMAs could potentially cross bearishly, they still maintain a golden crossover, supporting the bullish trend in the short- to medium-term.
Nasdaq
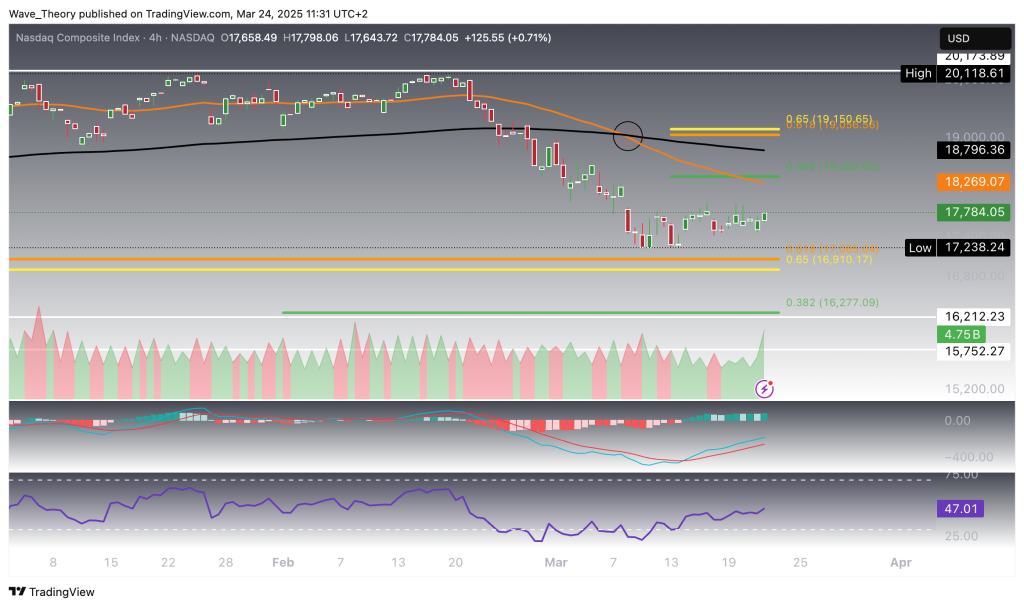
A Death Cross Has Emerged On The 4H Chart
On the 4-hour chart, the EMAs have formed a death cross, confirming a bearish trend in the short term. However, bullish momentum is emerging as the MACD lines have crossed bullishly, and the MACD histogram is ticking higher. The RSI remains neutral, neither indicating overbought nor oversold conditions.
Despite the death cross, Nasdaq could continue its upward move, potentially reaching the next significant Fibonacci resistance levels. This mixed technical picture suggests that while short-term caution is warranted, the bullish signals could drive further gains.
- Check out our free forex signals
- Follow the top economic events on FX Leaders economic calendar
- Trade better, discover more Forex Trading Strategies
- Open a FREE Trading Account
ABOUT THE AUTHOR
See More
Konstantin Kaiser
Financial Writer and Market Analyst
Konstantin Kaiser comes from a data science background and has significant experience in quantitative trading. His interest in technology took a notable turn in 2013 when he discovered Bitcoin and was instantly intrigued by the potential of this disruptive technology.
Related Articles


Comments
Subscribe
Login
Please login to comment
0 Comments
Oldest
Sidebar rates
Related Posts
