Amazon (AMZN) Stock Drops 21.7%: Is a Bullish Rebound on the Horizon?
Konstantin Kaiser•Monday, March 24, 2025•2 min read
Amazon stock (AMZN) has experienced a sharp 21.7% correction, hitting a key support level that could signal the potential for a bullish rebound. As investors watch closely, the stock’s current position may present an opportunity for a recovery in the near future.
Amazon (AMZN) Stock Hits Significant Support Zone: Is a Rebound Coming?
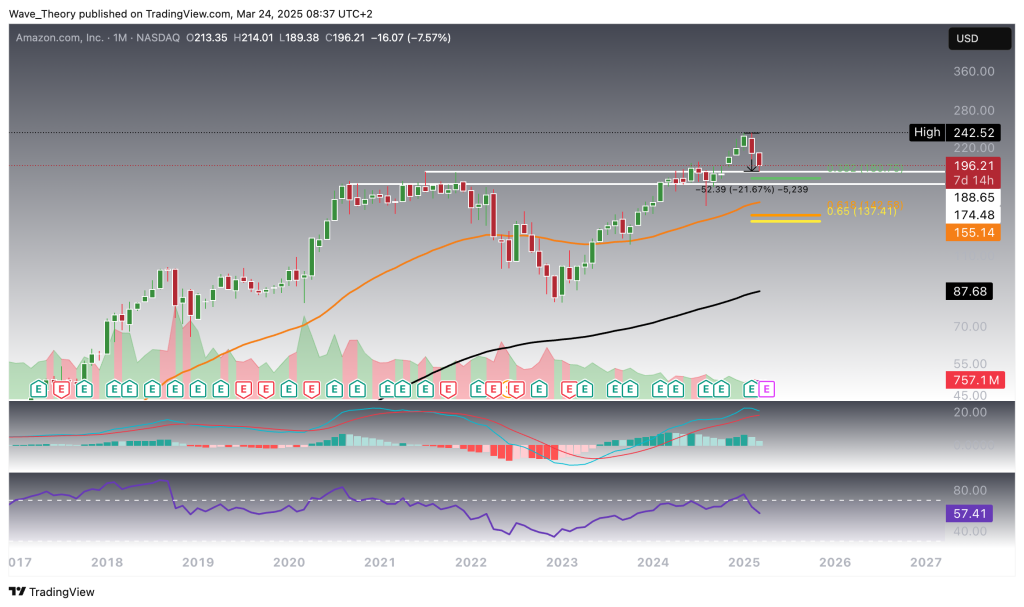
Amazon stock has experienced a two-month correction, with the MACD histogram showing a steady bearish decline. The MACD lines are nearing a bearish crossover on the monthly chart, signaling potential continued downward pressure. However, the RSI remains in neutral territory, and the EMAs continue to display a golden crossover, indicating that the long-term trend remains bullish.
Currently, AMZN has reached a significant support zone between $174.50 and $188.65, a critical area where a potential bullish bounce could occur. Additionally, the stock is finding key Fibonacci support levels at approximately $181 and $140, further reinforcing the possibility of a reversal in the near term. Traders should keep an eye on these levels for potential entry points.
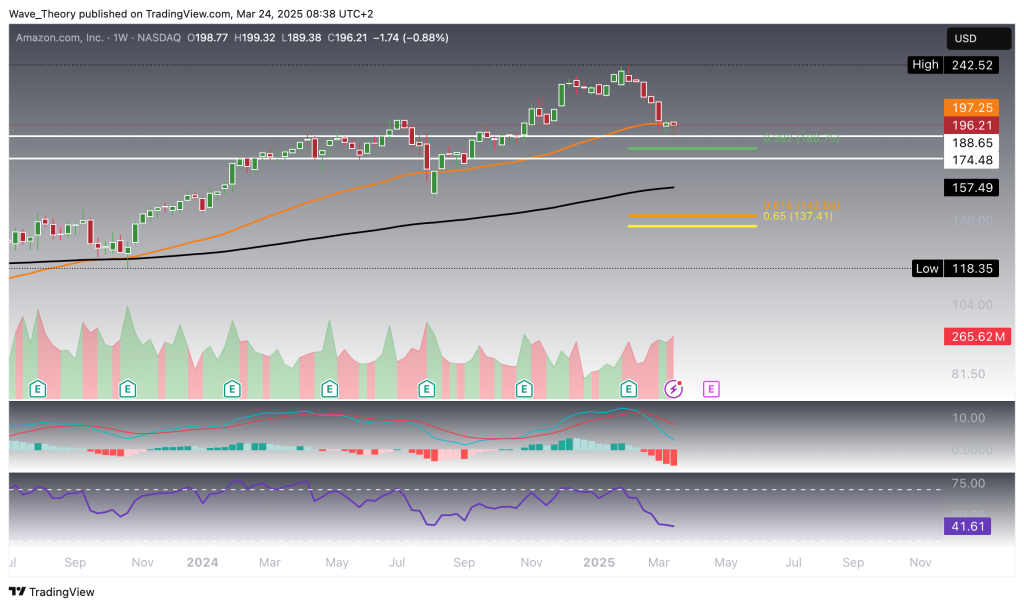
This week, Amazon (AMZN) appears to be bouncing bullishly off the $189 support level. A weekly close above the 50-week EMA at $197.25 would act as a strong bullish confirmation. Despite this, the overall technical picture remains mixed. While the EMAs maintain a golden crossover, signaling a bullish mid-term trend, the MACD paints a different picture.
The MACD lines are bearishly crossed, and the histogram shows a clear downtrend, suggesting continued downside pressure. Meanwhile, the RSI remains in neutral territory, neither overbought nor oversold. In summary, while the golden crossover supports a mid-term bullish trend, the MACD’s bearish signals warrant cautious optimism.
Amazon
Bullish MACD On The Daily Chart
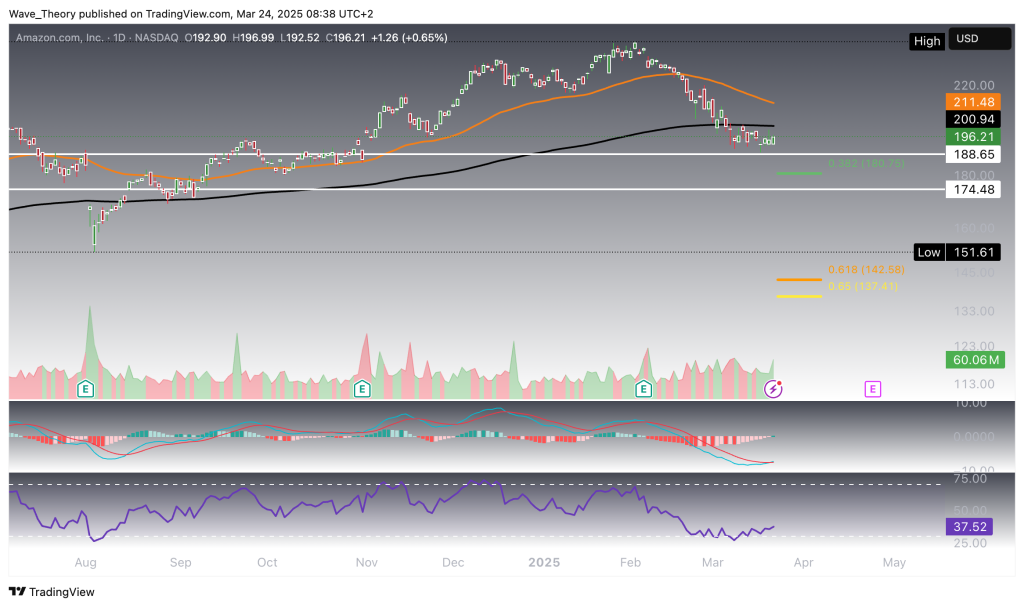
On the daily chart, Amazon (AMZN) is showing signs of bullish momentum as the MACD lines are on the verge of a bullish crossover, with the MACD histogram trending strongly upward. While the RSI remains neutral, neither overbought nor oversold, the EMAs are maintaining a golden crossover, confirming a bullish trend in the short- to medium-term. These technical signals suggest growing strength in the stock, with potential upside movement in the near future.
Amazon
Short-Term Bearish Signal for Amazon (AMZN): Death Cross Forms on 4H Chart
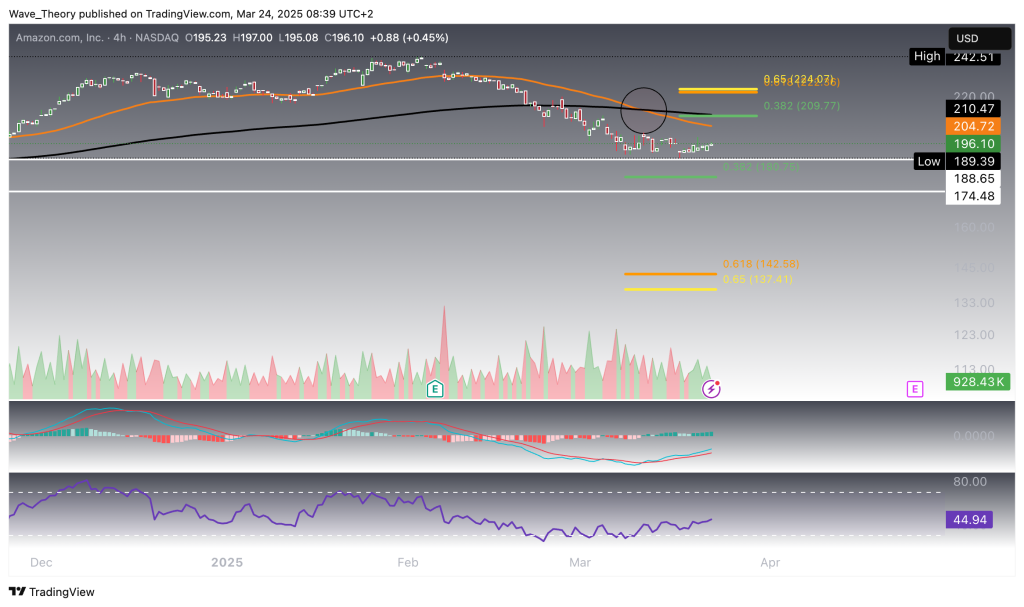
On the 4H chart, Amazon (AMZN) has formed a death cross, where the EMAs have crossed bearishly, signaling short-term downward pressure. However, the MACD lines have crossed bullishly, with the histogram showing a bullish uptick, while the RSI remains in neutral territory.
If Amazon extends its upward movement, it could target the next significant Fibonacci resistance levels at approximately $210 and $224. Should AMZN break through these levels, it has the potential to rally towards its all-time high (ATH) of $242.5 or even exceed it.
Konstantin Kaiser comes from a data science background and has significant experience in quantitative trading. His interest in technology took a notable turn in 2013 when he discovered Bitcoin and was instantly intrigued by the potential of this disruptive technology.