Ethereum (ETH) Surges Above $2,000 Amid Whale Accumulation and Bullish Technical Signals
Live ETH/USD Chart

Ethereum (ETH) has experienced a significant price surge, comfortably holding above the $2,000 mark and registering over a 4% gain in the past 24 hours. This upward momentum is being attributed to a combination of factors, including substantial accumulation by large ETH holders and the confirmation of a bullish technical pattern.
Whale Wallets Swell: Over 400,000 ETH Added to Accumulation Addresses
Data shows that among significant Ethereum holders, there is a clear accumulation tendency suggesting rising hope in the long run of the asset. These “accumulation addresses” have loaded more than 400,000 Ether into their balances over the previous 24 hours. Especially on March 12, these addresses saw record high inflows of 345,210 ETH.
Usually linked with long-term holding plans, these addresses are marked by their absence of outgoing transactions. These addresses have accumulated shockingly 4.73 million ETH in just three months alone in 2025 alone, implying a notable rise in accumulation when compared to the 5.8 million ETH accumulated throughout the whole previous 12-month period.
Based on this on-chain data, big players seem to be profiting from ETH’s present price, which nevertheless stays much below its all-time high.
Ethereum Foundation Announces Holesky Testnet Discontinuation, Hoodi to Take Over
In other news, on September 30, 2025 the Ethereum Foundation (EF) declared it would be ending the Holesky testnet. This choice follows from Holesky’s “extensive inactivity leaks” throughout its recovery procedure. Its replacement will be the just introduced Hoodi testnet, which went online on Monday.
Before releasing code modifications and improvements on the main Ethereum network, testnets are absolutely vital settings for developers to test them. Now the main testnet used for staking providers and validators will be Hoodi.
With a possible mainnet deployment about 30 days later, developers intend to activate the Pectra upgrade on Hoodi on March 26, providing the testing passes without any problems. Increased staking limits and account recovery options are among the various fresh features the Pectra upgrade will provide Ethereum.
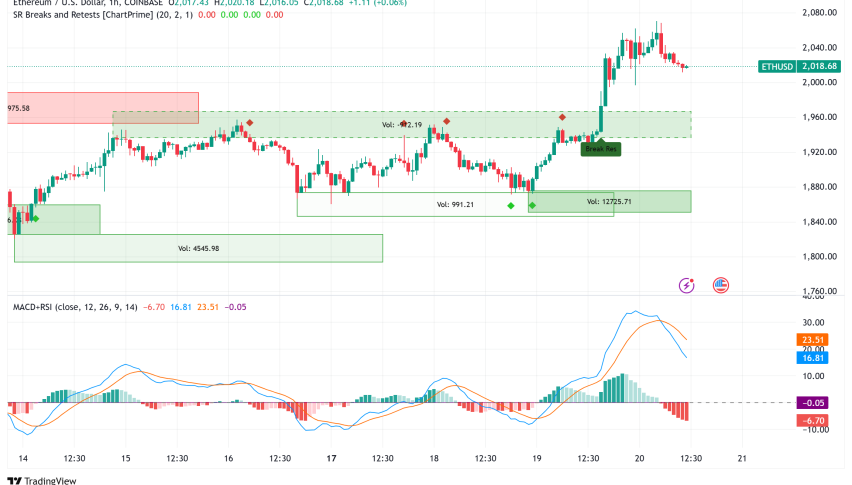
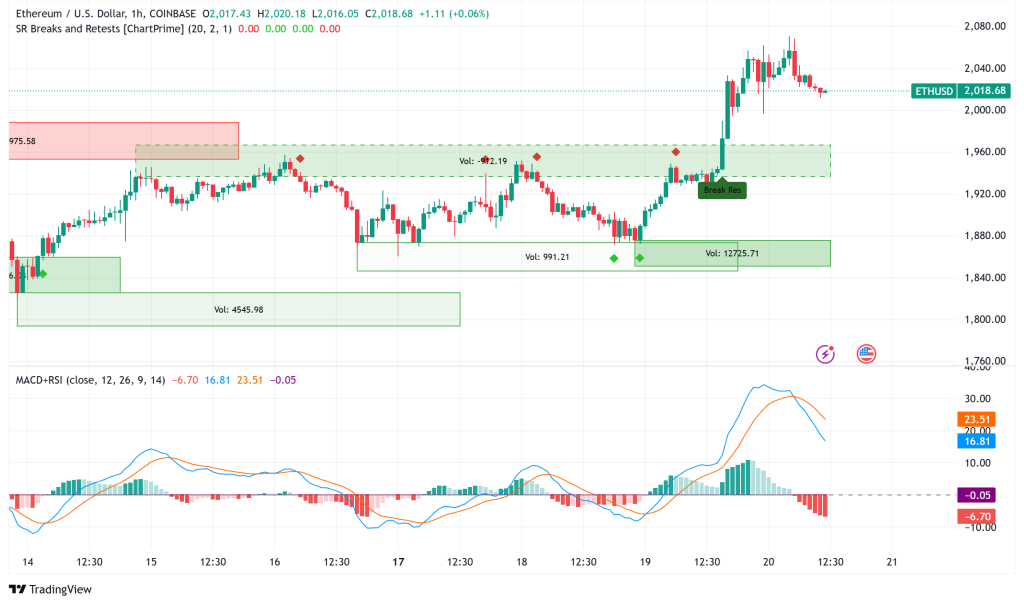
ETH/USD Technical Analysis: Further Upside After Ascending Triangle Breakout
Technically, Ethereum’s recent pricing behavior has verified a bullish breakout from an ascending triangle pattern. Usually indicating the continuance of an upward trend once the barrier is broken, this pattern is marked by rising lows and a constant resistance level (the neckline). After falling below $2,000 on March 10, ETH/USD developed higher lows and tried the $1,950 resistance often until breaking through.
Moreover, a positive difference between the price and the Relative Strength Index (RSI) preceded this break, suggesting declining bearish momentum and maybe trend reversal possibility. Now verified as a breakout, ETH’s immediate technical goal is roughly $2,142, roughly 5% above the present price. But right now sitting around $2,050, the 100-day exponential moving average (EMA) is functioning as an instantaneous barrier. ETH has to turn this EMA into a support level if it is to meet the $2,142 target.
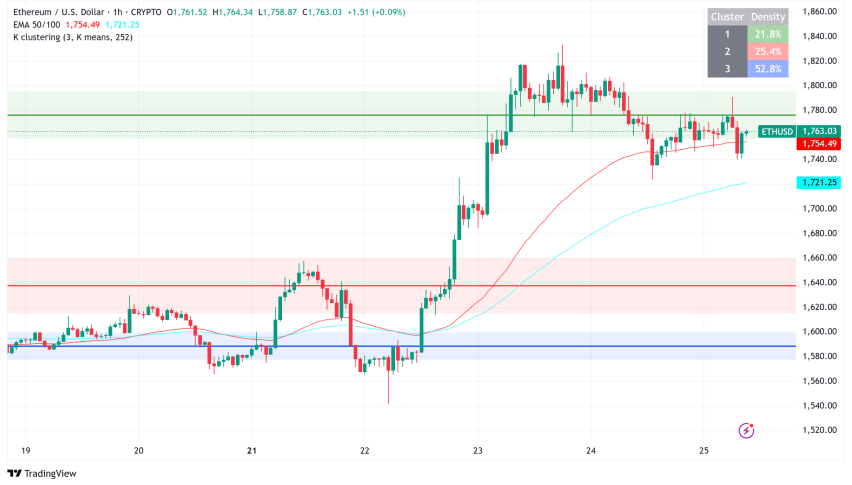
Short-Term Price Forecast: Eyes on $2,200 Resistance
Ethereum is looking at perhaps moving towards the $2,200 critical resistance level following the last rise. Originally attempting to surpass the $2,070 barrier, the price had already broken over a declining trendline resistance from late February. Rising technical indicators including the RSI and MACD point to declining bearish momentum.
Should ETH be able to maintain the declining trendline as support, a rally toward $2,070 and then $2,200 becomes rather likely. On the other hand, a rejection at $2,070 might cause a fall near the $1,818 support level. A daily candlestick close below $1,818 would contradict the current bullish argument and would perhaps send ETH towards the $1,500 support.
Ethereum Price Prediction: Multi-Year Demand Zone and Potential Macro Reversal
Adding to the positive attitude, crypto analyst Rekt Capital has noted that ETH has effectively tested its multi-year demand zone below the $2,000 level. The analyst believes that a strong positive response from this zone would open the path for ETH to recover the noteworthy $2,196-$3,900 macro range.
Elliott Wave Analysis Points Up Possibility for Additional Correction from a Bearish Viewpoint
Some analysts offer a negative perspective even with the present positive trend. An Elliott Wave theory study suggests Ethereum might be in the middle of a protracted ABC correcting trend starting in November 2021. Following a brief retracing (Wave B), this study indicates Ethereum is positioned for a last downward leg (Wave C), maybe reaching demand zones between $1,350 and $1,080, or perhaps as low as $760 and $530 should the first zone fail to retain.
If Ethereum closes a daily candle over $2,941, this bearish situation would be disproved nonetheless.
- Check out our free forex signals
- Follow the top economic events on FX Leaders economic calendar
- Trade better, discover more Forex Trading Strategies
- Open a FREE Trading Account
Related Articles
Comments
Sidebar rates
Related Posts
