Rigetti Computing Bounces Off Bullish Support, Surges Over 62%

Rigetti Computing Inc. (NASDAQ: RGTI) has corrected over 72% but has now reached a critical Fibonacci support level. At this key juncture, Rigetti’s stock has rebounded sharply, surging by more than 62% since last month. The question now remains: can Rigetti maintain its upward momentum?
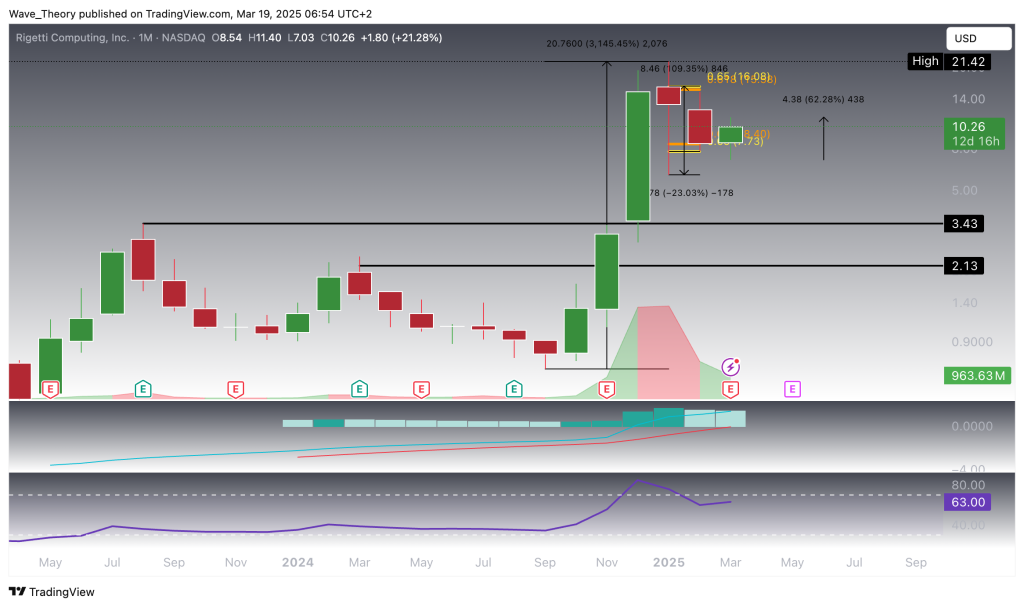
Rigetti Stock Surges 3,145% Before 72% Correction
Rigetti stock experienced an extraordinary rally, skyrocketing by over 3,145% within just four months. However, this meteoric rise was followed by a substantial correction, with the stock dropping over 72% in the last two months. Despite this decline, the stock has now found support at the critical golden ratio level of $8, from which it has bounced strongly, gaining over 62% this month.
Although Rigetti’s recent surge is promising, the stock faces a crucial test at the golden ratio resistance of $16. A breakout above this level would invalidate the ongoing correction phase and open the door for Rigetti to target its previous high of approximately $21.4.
The MACD lines remain bullishly crossed on the monthly chart, suggesting the potential for continued momentum, but the histogram is losing strength, ticking lower for the second consecutive month. The RSI is neutral, providing no clear direction at the moment, leaving traders awaiting further technical signals.
Rigetti Stock Bounces Off Bullishly: Can RGTI Continue Its Upward Move?
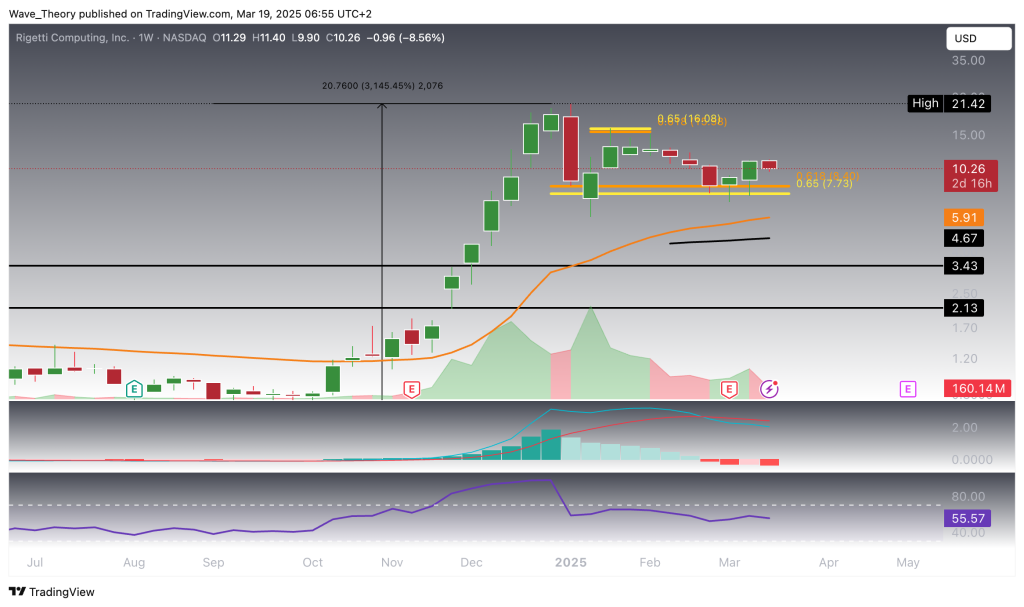
For the past two weeks, Rigetti Computing Inc. (NASDAQ: RGTI) has been trending upwards, showing positive momentum. However, this week, the bullish drive seems to be losing steam, raising concerns that RGTI may potentially retrace back to the critical golden ratio support at $8.
The MACD lines have crossed bearishly on the weekly chart, signaling a potential shift in momentum, while the MACD histogram has continued to tick lower, reinforcing the bearish outlook. Meanwhile, the RSI remains in neutral territory, offering no clear directional bias for traders.
If Rigetti fails to hold the golden ratio support at $8, a bearish breakdown could lead to further declines, with the next significant support level being the 50-week EMA at $5.90. Traders should closely monitor these key levels for potential continuation or reversal signals.
More Bullish Signals on the 4H Chart: RGTI Stock Eyes Golden Ratio Resistance
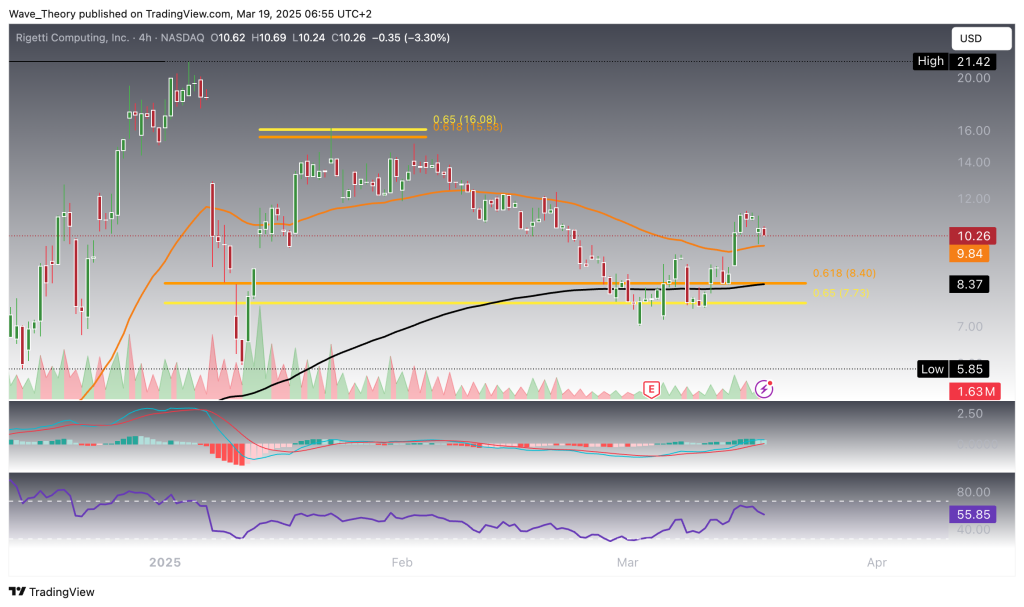
On the 4H chart, Rigetti Computing Inc. (NASDAQ: RGTI) is displaying further bullish signals. Both the EMAs and MACD lines are crossed bullishly, confirming the continuation of the bullish trend in the short term. While the RSI remains in neutral territory, offering no immediate directional bias, it leaves room for potential upward movement.
If Rigetti can hold above the 50-day EMA support at $9.93, the stock may soon set its sights on the next major target—the golden ratio resistance at $16. Traders should watch for this key level as Rigetti’s momentum continues to build.
- Check out our free forex signals
- Follow the top economic events on FX Leaders economic calendar
- Trade better, discover more Forex Trading Strategies
- Open a FREE Trading Account
Related Articles


Comments
Sidebar rates
Related Posts
