Ethereum Struggles Below $2,000 Amid Market-Wide Pressure
Ethereum's native token has failed to regain momentum after dropping below the crucial $2,000 psychological level on March 10. While Bitcoin
Live ETH/USD Chart

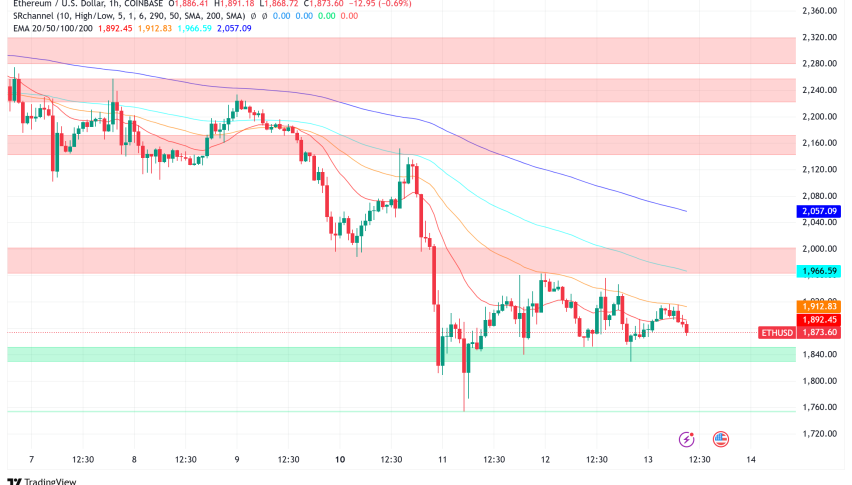
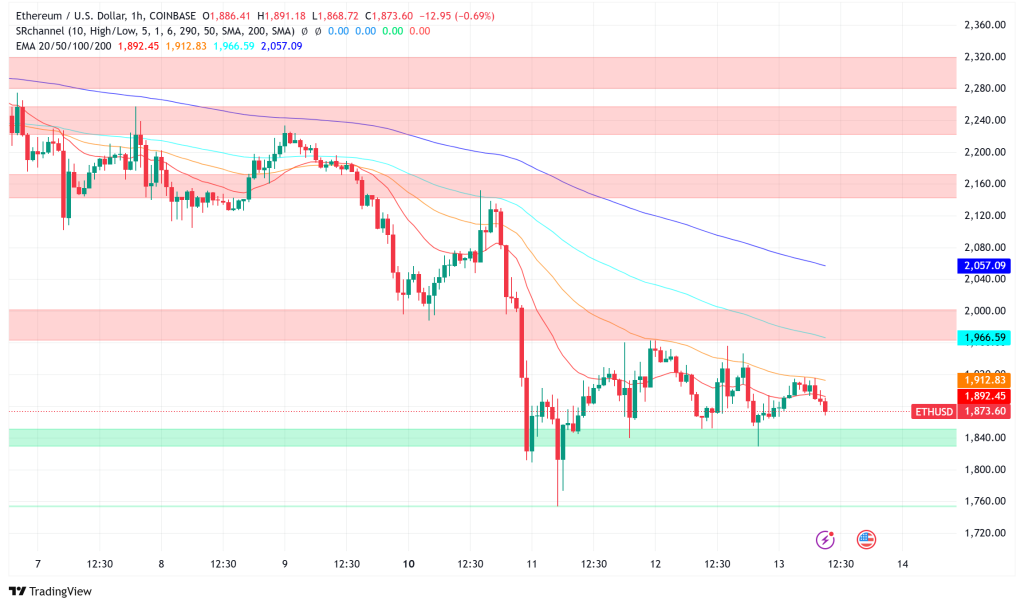
Ethereum’s native token has failed to regain momentum after dropping below the crucial $2,000 psychological level on March 10. While Bitcoin BTC/USD and other altcoins have shown minor recoveries, Ethereum ETH/USD continues to face bearish pressure, recently forming a short-term resistance at $1,920.
Ethereum Network Activity Drops to Concerning Levels
From its December 2024 peak of $77 billion, Ethereum’s Total Valuelocked (TVL) has dropped significantly to a six-month low of $45.6 billion as of March 12. Furthermore indicating declining network activity, overall user fees paid on Ethereum have dropped to $46.28 million—the lowest amount since July 2020.
These numbers show declining activity across the Ethereum ecosystem even if the network still rules the decentralized finance (DeFi) market.
ETH/BTC Ratio Strikes Five Year Low
With its lowest level since mid-2020, the ETH/BTC ratio—which shows Ethereum’s strength in relation to Bitcoin—has dropped to 0.22751. This is seen by some market players as a possible rotation signal; trader Alex Kruger advises investors to look at transferring from ETH to higher-beta altcoins.
On social media, Kruger said “if still stuck on ETH, it is likely a good time to dump it to buy a higher beta altcoin.” “You’ll most likely lose equally in both cases if the market declines; but, if it rises, you’ll probably outperform greatly and can then swap into BTC.”
Historically, an altcoin season usually follows a low ETH/BTC ratio bottom-out. But with a score of just 13 out of 100, CoinMarketCap’s Altcoin Season Index indicates that Bitcoin’s supremacy—which right now stands at 62.15%—may last for some time.
Ether ETF Options Decision Postponed by SEC
The US Securities and Exchange Commission has postponed ruling on whether to let Cboe BZX Exchange list options linked to Fidelity’s Ethereum ETF. Based on a March 12 filing, the agency has extended its timeframe until May 14 to approve or reject Cboe’s proposal for the Fidelity Ethereum Fund (FESH).
This delay corresponds with similar delays in February for suggested regulation changes by Cboe Exchange and Nasdaq ISE. Remaining the biggest ETH ETF with over $3.7 billion in assets, the SEC is poised to determine by April whether Nasdaq can offer options linked to BlackRock’s iShares Ethereum Trust (ETHA).
Attracting institutional money to the bitcoin market depends critically on listing choices on Ethereum ETFs. Spot Ethereum ETFs have drawn around $7 billion in net assets since their July 2024 launch; among the most sought-after products are BlackRock’s ETHA and Fidelity’s FESH ($780 million in assets).
In a similar development, Cboe BZX recently asked permission to include staking into Fidelity’s Ether ETF, which would improve returns by letting ETH be collateral with validators in exchange for rewards—a function not yet allowed by any publicly traded US Ether fund.
ETH/USD Technical Analysis Signals Continued Pressure
On March 11, the cryptocurrency dropped to a multi-year low of $1,252; on-chain data points point to possible more downside. Glassnode analytics claims that ETH fell below its stated price of $2,054 for the first time in more than a year, signifying general unrealized losses all throughout the network.
With a market value to realized value (MVRV) ratio of 0.93, average 7% loss for all ETH holders network-wide is reflected. This indicator covers the cost basis of every ETH owner and shows the weighted average of all past transactions.
Technical chart study indicates ETH running across opposition at the 23.6% Fibonacci retracing level. With a negative trend line creating opposition at $1,920, the price now trades below the 100-hourly Simple Moving Average. Ethereum has to clear the $1,920 and $1,950 levels for any significant comeback, and more opposition between $2,000 and $2,060.
Analyst Points of View: Bottom Between $1,600 and $1,900.
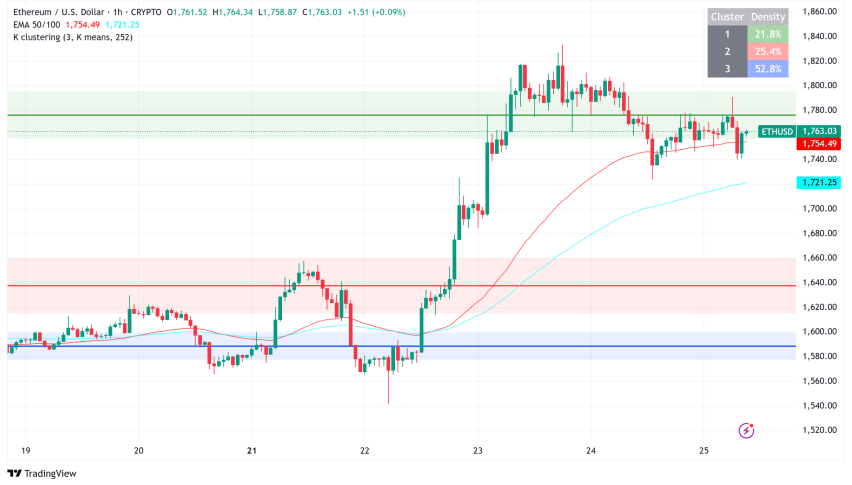
According to Glassnode’s latest research, Ethereum’s cost-basis distribution might point up possible support levels. Based on their statistics, 600,000–700,000 ETH accumulated around $1,900, suggesting that, should consolidation keep at present levels, this price point provides significant support.
“The supply gap between $1.9K and $2.2K remains thin, thus a short-term move towards resistance is plausible,” Glassnode says.
With a possible high swing objective at $2,500, anonymous analyst Ninja says Ethereum’s floor price stays between $1,600 and $1,900, characterizing this range as “attractive region for commercial money”.
- Check out our free forex signals
- Follow the top economic events on FX Leaders economic calendar
- Trade better, discover more Forex Trading Strategies
- Open a FREE Trading Account
Related Articles
Comments
Sidebar rates
Related Posts
