


Solana Technical Indicators Signal Potential Reversal After 93% Network Revenue Plunge

Solana (SOL) finds itself at a critical juncture, trading around $122 as the cryptocurrency struggles to maintain momentum amid a significant decline in network revenue and ecosystem activity. After reaching all-time highs in January, SOL/USD has experienced a sharp reversal, with multiple technical indicators now pointing to continued bearish pressure in the short term.
Solana Network Revenue Collapses 93% Since January Peak
Originally a rising light in the crypto market, Solana has seen an astonishing 93% collapse in network income from a record $55 million in January to only $4 million in recent weeks. The lowest income numbers since September of last year and a more general loss of momentum across the Solana ecosystem this drastic decline marks.
The loss goes beyond just network income. Revenue from decentralised applications (DApps) on Solana has similarly dropped, 86% from $238 million in January to roughly $32 million in the previous week. Concurrently, Total Value Locked (TVL) in Solana’s DeFi system has dropped 50%, from over $12 billion at its January peak to $6.4 billion at present.
Memecoin Frenzy Fades, Taking Solana’s Momentum With It
Market watchers blame most of Solana’s recent problems on the declining interest in memecoins, which formerly generated significant network activity. A VanEck analysis indicates that the Pump.fun memecoin platform accounted for almost 80% of Solana’s income; daily revenue fell from $15 million in late January to barely $800,000 currently—a 95% drop.
From a market value of $137 billion in December to roughly $44 billion today, the memecoin market overall has contracted greatly. Solana has suffered especially from this sector-wide drop since its network income mostly depends on memecoin activity.
Future Network Improvements Might Set off Recovery
Though the view is pessimistic, Solana has possible triggers right ahead. Solana Improvement Document (SIMD)-0228 is under discussion in the network; it seeks to improve SOL tokenomics by means of improved inflation model. A good implementation could inspire developers back into the ecosystem and raise investor confidence.
Regulating changes are also playing background role. Recent delays by the SEC on numerous altcoin ETFs—including spot Solana ETF filings—have With final deadlines not until October, Bloomberg ETF analyst James Seyffart pointed out that these delays are “standard procedure” and have no detrimental effect on the “relatively high” odds of ultimate acceptance.
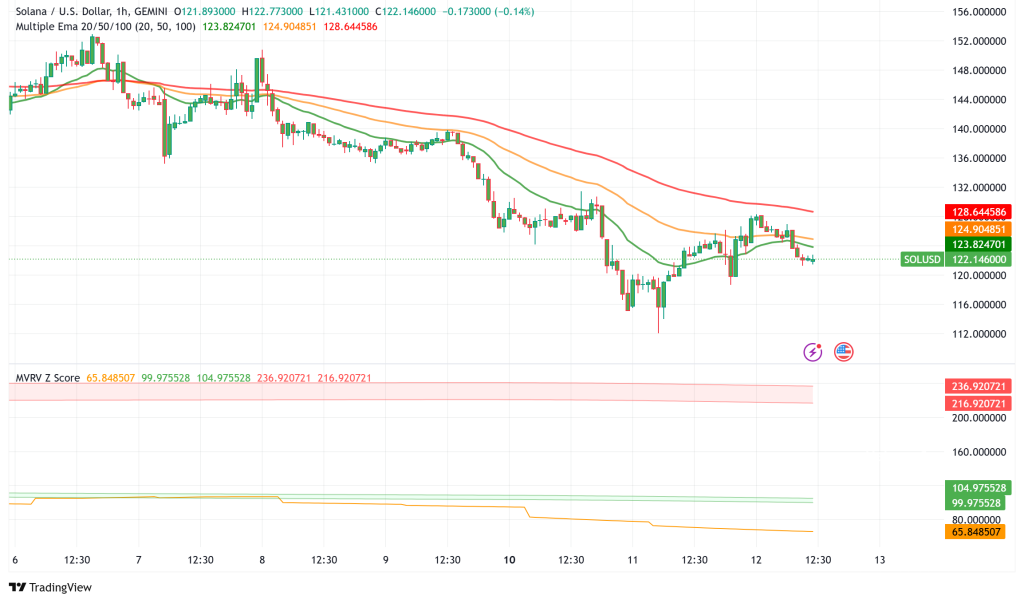
SOL/USD Technical Analysis: SOL Breaks Below Critical Realized Price
Glassnode’s on-chain data points to a worrying trend. For the first time in almost three years Solana has dropped below its Realized Price. This statistic, which shows SOL holders’ average cost base, points to the average investor being presently about 8% underwater on their investment.
Historically, falls below the Realized Price have heralded the start of protracted crypto bear markets. Solana traded below this mark last time in 2022, before a protracted decline. This trend along with comparable swings in Bitcoin’s short-term holder Realized Price point to possible further downward pressure across the bitcoin market.
Critical Support at $120 Could Determine SOL’s Trajectory
Technical chart study reveals that $120 is now Solana’s most important supporting level. Historically attracting buyers, this price range could decide if SOL recovers or keeps sliding near the $100 level. Still below 40, the Relative Strength Index (RSI) shows oversold circumstances as well as reflects strong negative attitude.
Characteristically of a bearish market, the one-day SOL/USD chart exhibits a sequence of declining price patterns. Long-term support levels have already been broken by prices, hence extended red candlestick movements indicate ongoing selling pressure. Should the $120 support collapse, technical analysts see a possible drop into the $100 psychological barrier.
Increased Trading Volume Signals Possible Capitulation Phase
Recent data from CoinMarketCap reveals a clear rise in SOL trading volume, usually a sign of more market attention during times of major price fluctuation. Increased volume can indicate a capitulation phase as sellers are aggressively leaving positions when following declining price action.
Should this capitulation draw fresh buyers at reduced rates, it may create a temporary bottom. Solana’s short-term path will most likely be determined by the interaction between rising volume and price action at the important $120 support level.

Sidebar rates
Related Posts
Add 3440

