Ethereum’s Market Momentum Weakens as ETH Struggles Below $2,100
Ethereum (ETH) has fallen below a critical support threshold, trading at approximately $2,051 as of Monday morning. The second-largest
Live ETH/USD Chart

Ethereum (ETH) has fallen below a critical support threshold, trading at approximately $2,051 as of Monday morning. The second-largest cryptocurrency by market capitalization, ETH/USD has shed over 5.5% in the past 24 hours, extending a downtrend that has seen the asset decline nearly 20% in the previous week.
Trump’s Crypto Reserve and Market Reaction
The market-wide selling pressure resulting from President Donald Trump’s Executive Order creating a Strategic Bitcoin Reserve helps to explain part of Ethereum’s recent woes. Although the sequence marks a turning moment in the acceptance of cryptocurrencies by institutions, traders were letdown by the lack of quick government buying pledges.
“The knee-jerk reaction lower likely stems from the realization that no actual budget has been allocated for Bitcoin purchases in the near term,” Singapore-based digital asset trading company QCP Capital said in a recent market update.
The executive order creates separate reserves for Ethereum among other cryptocurrencies including Bitcoin. But the White House has clearly positioned Bitcoin as deserving “special treatment” because of its security and decentralizing properties, therefore generating uncertainty for Ethereum investors.
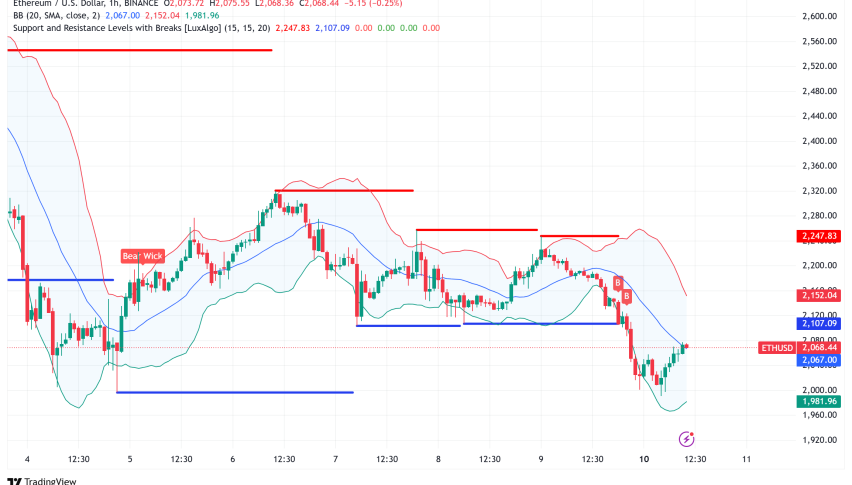
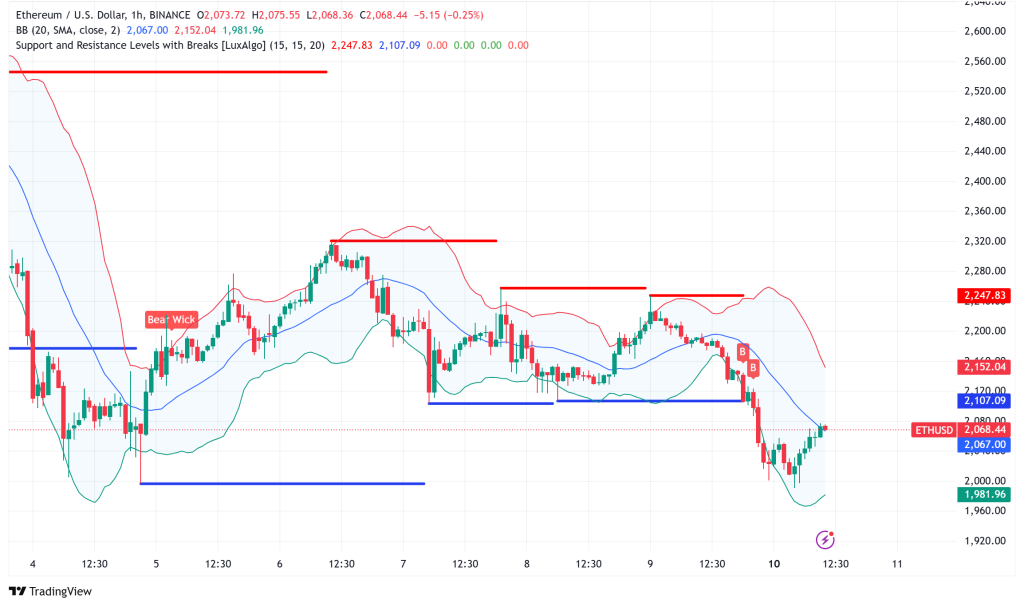
ETH/USD Technical Analysis Points to Crucial Support Level
Multiple technical indicators suggest Ethereum stands at a decisive moment. The asset has remained trapped below critical resistance levels for over a year, demonstrating persistent weakness.
Renowned analyst Tony “The Bull” Severino highlighted Ethereum’s failure to break above the quarterly Parabolic SAR indicator despite numerous attempts, signaling that “resistance won’t be broken” in the near term. Severino’s analysis further emphasizes Ethereum’s rejection at the quarterly SuperTrend dynamic resistance, confirming buyers’ inability to regain control of the market.
Most concerning for Ethereum holders is the critical support at $2,100. According to technical analysis of quarterly Bollinger Bands, which have tracked ETH’s price action since February 2022, a monthly close below this threshold could have severe consequences. The lower Bollinger Band currently sits at $2,098, with a break below potentially triggering accelerated selling.
ETH Whale Accumulation Indicates Possible Reversal
On-chain data suggests notable institutional interest at current price levels despite the bearish technical view. Based on crypto expert Ali Martinez’s observations of wallets containing more than 100,000 ETH accumulating about 330,000 ETH in just 48 hours, it is clear that big investors find the present pricing appealing.
This accumulation pattern matches what some researchers find to be a Wyckoff reaccumulation phase. This technical pattern points to Ethereum maybe moving into the “Spring” phase, usually the last shakeout before a significant climb higher.
Historical Comparison Offers Bullish Perspective
Some market watchers have compared Ethereum’s present price movement with its market cycle from 2016 to 2017. Analyst Merlijn argues that the 2017 rally underwent a similar consolidation period, punctuated by a fake-out prior to an accelerated climb.
Should this historical trend recur, Ethereum may be positioned for a notable breakthrough even with its recent decline. Still, the asset’s capacity to surpass the crucial $2,100 support level is the immediate issue of concern.
Ethereum Price Prediction
After rejecting about its neutral level of 50 last week, the RSI on Ethereum’s daily chart reads 35, signaling ongoing bearish trend. Likewise, the MACD displays a bearish crossover, implying a continuation of the declining trend.
Should ETH fail to recover the $2,125 mark, its fall might stretch to retest weekly support at $1,105. On the other hand, a rebound over $2,125 might find the asset face resistance at $2,359.
- Check out our free forex signals
- Follow the top economic events on FX Leaders economic calendar
- Trade better, discover more Forex Trading Strategies
- Open a FREE Trading Account
Related Articles

Comments
Sidebar rates
Related Posts
