Robinhood
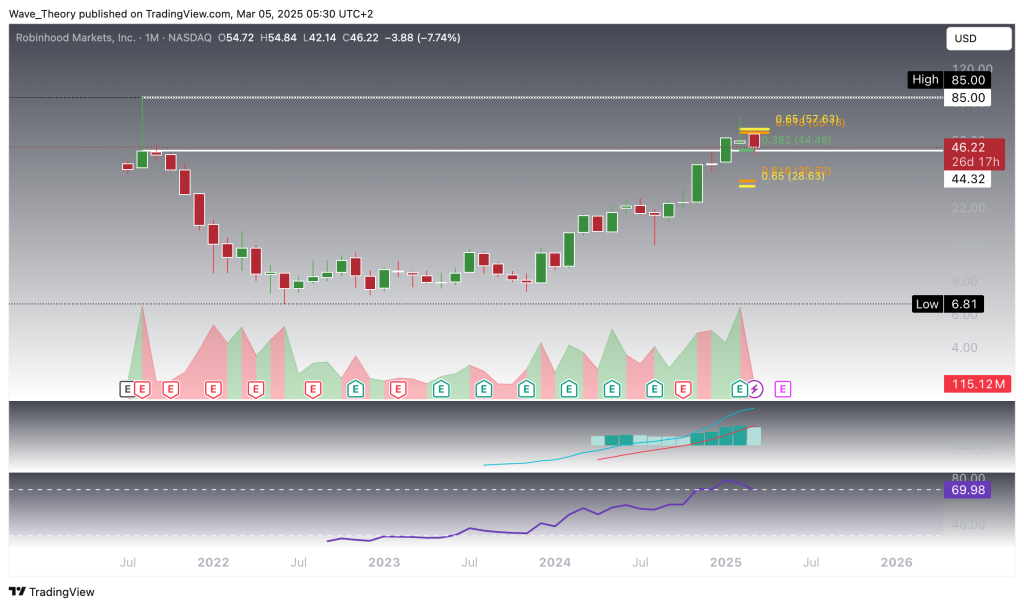
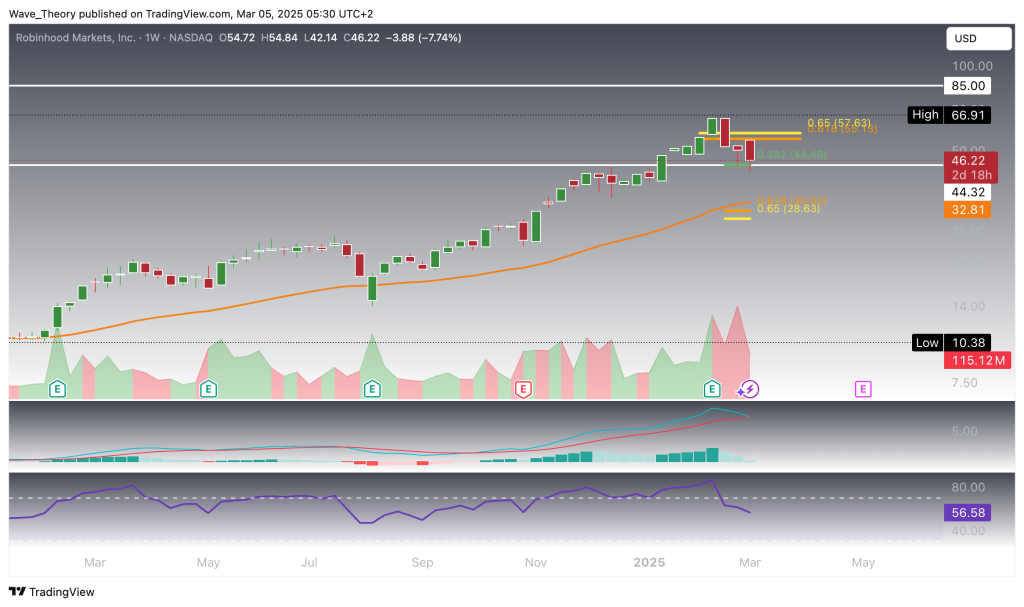
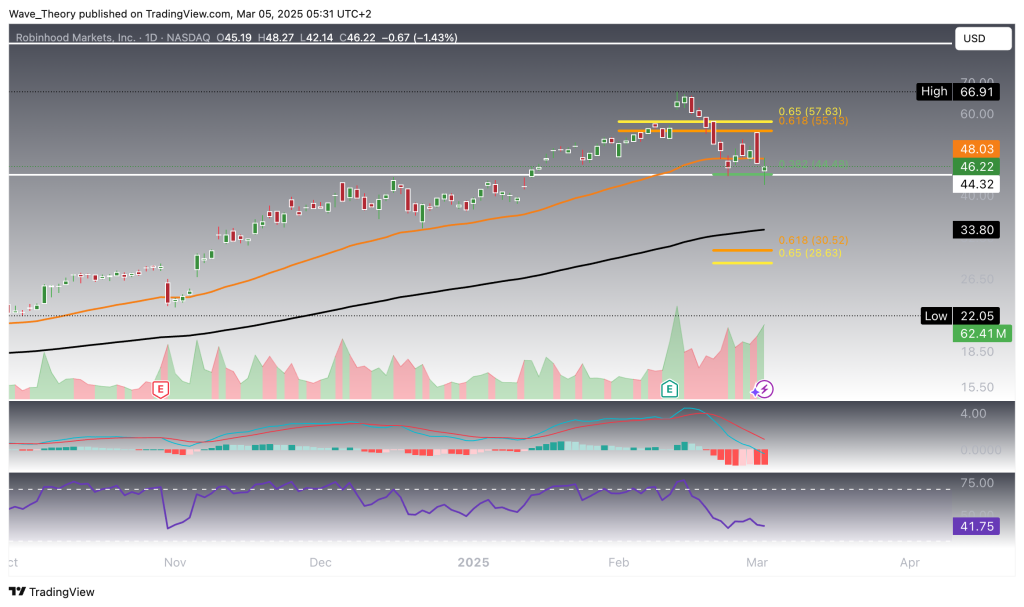
Robinhood (HOOD) Stock Briefly Exceeds $57 Golden Ratio Resistance Before Facing Rejection
Konstantin Kaiser•Wednesday, March 5, 2025•2 min read
Robinhood (HOOD) briefly broke above the golden ratio resistance at $57, signaling potential bullish momentum. However, this breakout was short-lived, as the stock closed below the level last month and is now facing a potential rejection at this critical resistance.
Robinhood Stock Faces Rejection at Key $57 Golden Ratio Resistance
Robinhood (HOOD) failed to sustain a close above the crucial golden ratio resistance at $57, a level that could have triggered a new bullish cycle, potentially pushing the stock towards its all-time high (ATH) of $85 or beyond. This rejection at $57 has now pushed the stock down toward the 0.382 Fibonacci support at $44.5. If this level fails to hold, Robinhood could retrace further to the golden ratio at $29. As long as HOOD remains above $29, the bullish trend from the past 16 months remains intact.
However, bearish signals are starting to emerge. The MACD histogram is ticking lower this month, though the MACD lines are still bullishly crossed. Meanwhile, the RSI is approaching overbought territory, suggesting limited upside in the near term.

More Bearish Signals on the Weekly Chart for Robinhood Stock
On the weekly chart, Robinhood (HOOD) shows further bearish momentum as the MACD lines approach a bearish crossover, with the histogram declining for the past three months. The RSI remains neutral, offering no clear directional bias. If Robinhood breaks its current support level, additional support can be found near the 50-week EMA, just above the golden ratio at $33.

Robinhood Set for a Bullish Bounce?
On the daily chart, Robinhood (HOOD) displays mixed signals. While the MACD lines are bearishly crossed and the histogram has been declining since yesterday, the EMAs still confirm the bullish trend in the short- to medium-term. The RSI remains neutral, providing no clear directional bias. If Robinhood manages to bounce off the 0.382 Fibonacci support at $44.5, it could retest the key golden ratio resistance at $57.

Bullish Divergence Emerges on the 4H Chart for Robinhood Stock
On the 4-hour chart, a bullish divergence is forming on the RSI, aligning with the 0.382 Fibonacci support. This confluence could present an ideal entry point for bulls seeking a short-term bounce in Robinhood (HOOD). However, despite the bullish setup, the MACD lines remain bearishly crossed, and the histogram is fluctuating between bullish and bearish signals. Meanwhile, the EMAs are still crossed bullishly.
If Robinhood bounces from this level, it could face resistance at the 50-4H EMA around $51 or the golden ratio at $57. Breaking through these levels could propel the stock toward its previous high of $66, with the potential to surpass it. However, for a confirmed new bull cycle, Robinhood would need to secure a monthly close above the $57 golden ratio resistance level.
Check out our free forex signals
Follow the top economic events on FX Leaders economic calendar
Trade better, discover more Forex Trading Strategies
Konstantin Kaiser
Financial Writer and Market Analyst
Konstantin Kaiser comes from a data science background and has significant experience in quantitative trading. His interest in technology took a notable turn in 2013 when he discovered Bitcoin and was instantly intrigued by the potential of this disruptive technology.
Related Articles
Comments
0
0
votes
Article Rating
Subscribe
Login
Please login to comment
0 Comments
Oldest
Newest
Most Voted
Inline Feedbacks
View all comments
Sidebar rates
Add 3442
Related Posts
XM
Best Forex Brokers
