Microsoft (MSFT) Stock Faces Bearish Signals: Death Cross, Key Support Levels, and Potential for Rebound

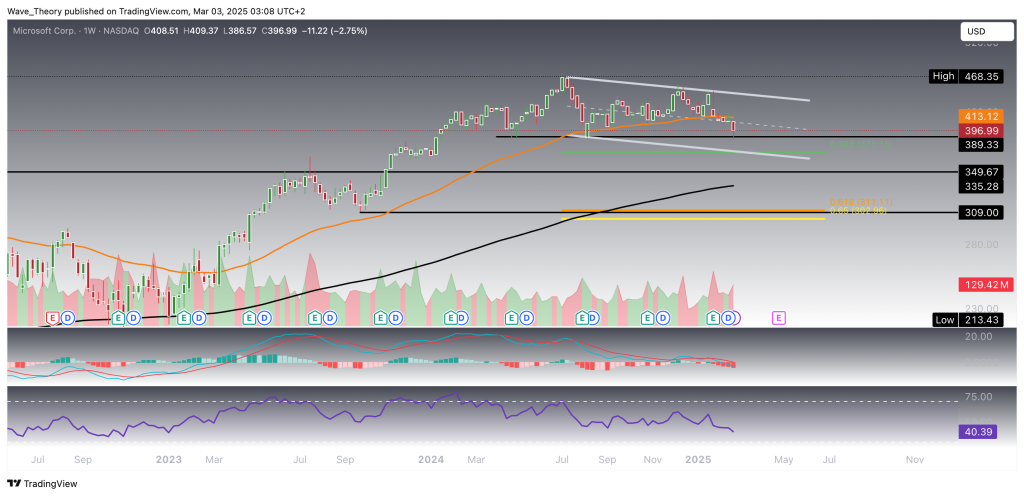
Microsoft (MSFT) Stock Trending Lower in a Parallel Downward Channel
On the weekly chart, Microsoft (MSFT) is trending lower within a defined parallel downward channel. Should the stock break below key support levels, it could retrace further to the golden ratio support at $310. Despite this, as long as MSFT holds above $310, the overall long-term bullish trend remains intact, reinforced by the mid-term confirmation of the golden EMA crossover.
That said, bearish momentum is building, with the MACD lines bearishly crossed and the histogram continuing to trend downward. Meanwhile, the RSI remains neutral, offering no clear directional bias at this stage.
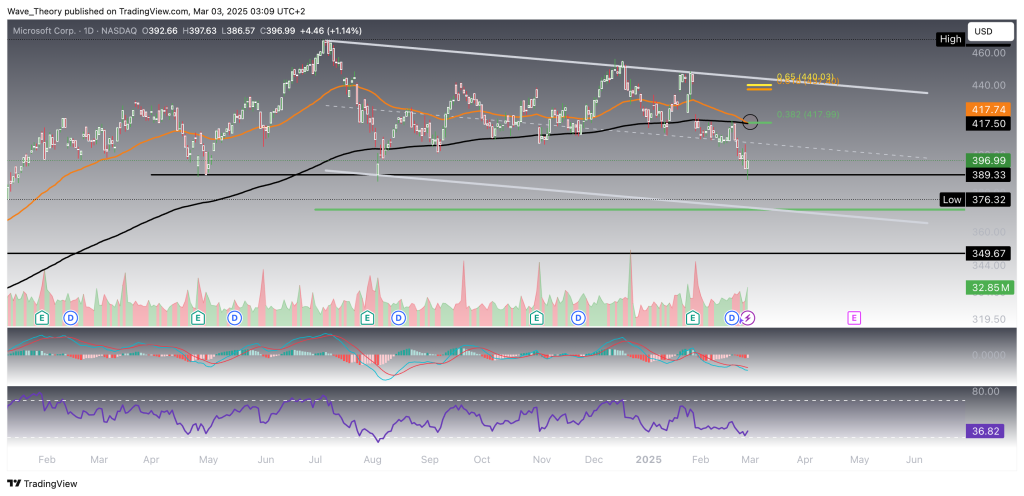
Bearish Signal: Death Cross Emerges on the Daily Chart
On the daily chart, Microsoft (MSFT) is on the verge of forming a death cross, as the EMAs are about to cross bearishly, confirming a bearish trend in the short- to medium-term. Additionally, the MACD lines remain bearishly crossed, with the histogram predominantly ticking lower. The RSI is neutral, providing no strong directional signal.
However, if Microsoft manages to bounce off the $389 support level, it could encounter significant Fibonacci resistance at $418 and $440. A break above the golden ratio would invalidate the current correction phase and reestablish the uptrend, with the potential to retest or even surpass its all-time high of $468.
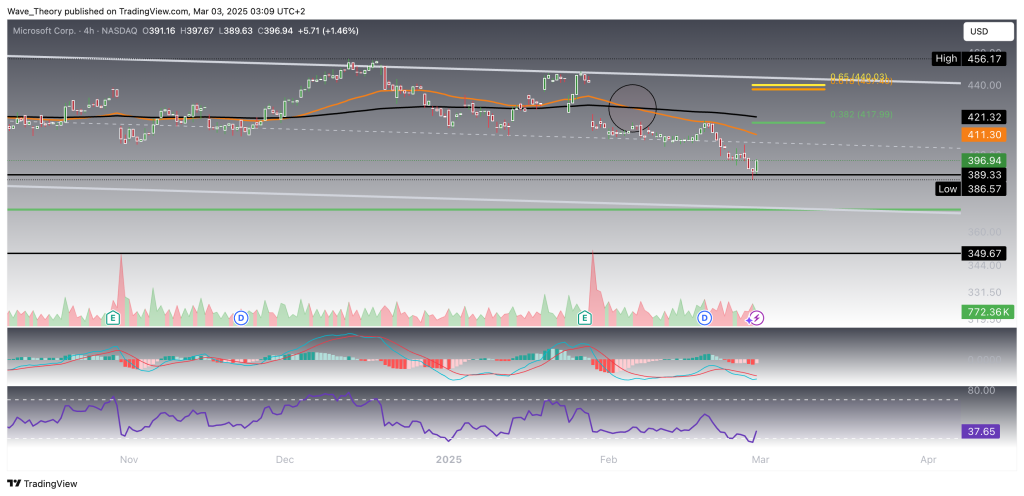
Similar Outlook on the 4H Chart for Microsoft Stock
The 4H chart mirrors the broader bearish signals seen on higher timeframes. The MACD lines remain bearishly crossed, the RSI stays neutral, and the EMAs have already formed a death cross, confirming a bearish short-term trend.
As long as Microsoft (MSFT) stock fails to break above the golden ratio resistance at $440, the correction phase remains intact, signaling the potential for further downside.
- Check out our free forex signals
- Follow the top economic events on FX Leaders economic calendar
- Trade better, discover more Forex Trading Strategies
- Open a FREE Trading Account
Related Articles


Comments
Sidebar rates
Related Posts
