Dogecoin Price Surges 4% to $0.20 Amidst ETF Buzz and Bullish Technical Signals
Dogecoin (DOGE), the original meme cryptocurrency, is currently trading around $0.20, marking a notable 4% increase over the past 24 hours.

Live DOGE/USD Chart

Dogecoin (DOGE), the original meme cryptocurrency, is currently trading around $0.20, marking a notable 4% increase over the past 24 hours. This DOGE/USD price uptick coincides with a surge in optimism surrounding the potential approval of a Dogecoin exchange-traded fund (ETF) in the US.
Polymarket estimates a 67% probability, while Bloomberg analysts are even more bullish, predicting a 75% chance of a DOGE ETF being greenlit by the Securities and Exchange Commission (SEC) in 2025. However, this ETF-driven enthusiasm is tempered by recent market volatility, as Dogecoin experienced a sharp 16% price drop just recently, highlighting the meme coin’s inherent price swings.
Dogecoin ETF Filings: Bitwise and Grayscale Lead the Charge
A Dogecoin ETF is becoming more and more likely as the SEC reviews several filings right now. Seeking to list the Bitwise Dogecoin ETF, NYSE Arca has applied under 19b-4. With Bank of New York Mellon managing cash assets, this filing records Coinbase Custody handling the ETF’s Dogecoin holdings. Using the CF Dogecoin-Dollar Settlement Price, Bitwise seeks to monitor the market value of Dogecoins.
Following Bitwise’s S-1 submission, this file links subsequent applications from industry titans including Grayscale and Rex Shares. The Dogecoin ETF application of Grayscale is said to be further advanced in the SEC’s review process, which fuels the increasing expectation among the Dogecoin community.
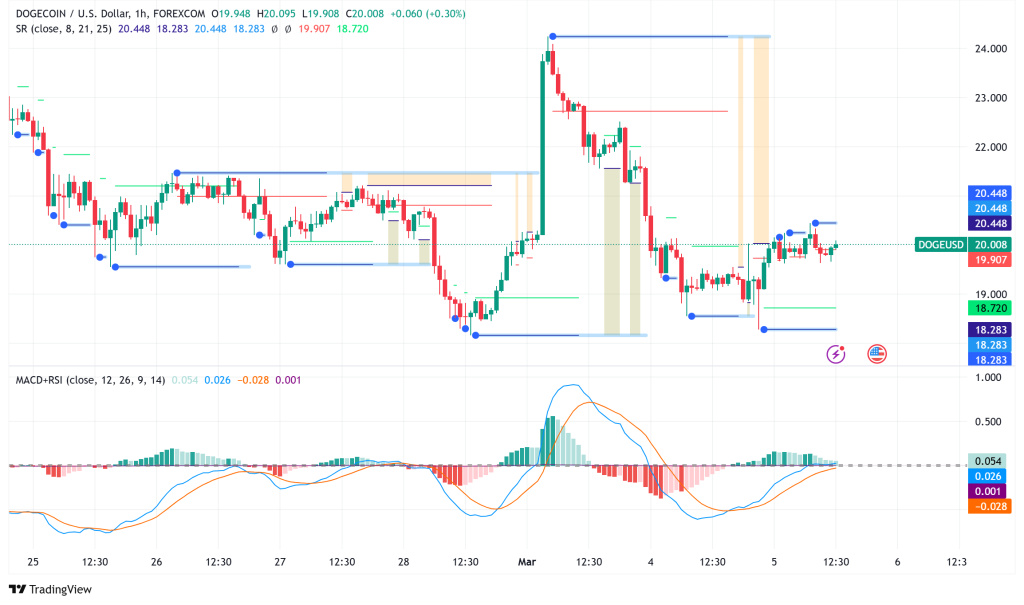
DOGE/USD Technical Analysis: H1 Chart Pauses Bearish Move at $0.1850 Support
Though the Dogecoin ETF news is positive, the recent price movement of Dogecoin exposes an erratic scene. Initiated by a rejection at the $0.2400 resistance level, the DOGEUSD hourly chart exhibits a notable bearish movement akin to a bearish engulfing candle. This resulted in a declining trend until the price found support about the $0.1850 level.
Technical analysts say this $0.1850 level is absolutely vital. Looking for optimistic reversal patterns to start long positions, buyers could be seeing this support for a possible bounce. On the other hand, sellers are probably looking for evidence to support a break below $0.1850 so they may lower the price even further.
Dogecoin Attempts Rebound, Faces Resistance at $0.2050 and $0.2120
Dogecoin is bottoming down at $0.1820 and is trying a rebound following a fresh fall below the $0.2150 zone. DOGE is currently compassing below the $0.2150 resistance level. Immediate upside resistance is close to $0.2050, with a more important barrier at $0.2120, corresponding with the 50% Fibonacci retracing level of the recent negative movement from the $0.2421 swing high.
On the down side, initial support is observed close to $0.5050, then follows strong support at $0.1820. A breach below this $0.1820 level would set off a more severe drop toward $0.1740 or perhaps $0.1650. Jindal does, however, also point out a break above a negative trendline at $0.1900 on the hourly chart, implying a possible momentum change should DOGE conquer the $0.2050 and $0.2120 resistance levels. The Hourly MACD is exhibiting declining bearish momentum right now, while the Hourly RSI has surged over 50 suggesting a potential bullish move.
Dogecoin Price Prediction: Bullish Dragonfly Doji Pattern Suggests Potential Reversal
Complementing the positive technical signs, notable trader Trader Tardigrade noted on the daily chart of Dogecoin on March 5, 2025 a Dragonfly Doji formation. Usually found around the bottom of a downtrend, this pattern is seen as a strong sign of possible market reversal and strengthening. Trader Tardigrade’s research shows that a break over the present resistance level, formerly around $0.082 (applying this to current price levels, this might translate to a break above $0.2150 – $0.22, therefore validating this bullish reversal signal and drawing more buying activity.
Technical analysis by Trader Tardigrade also fit a possible rising trend, thereby supporting this optimistic view. DOGE’s Relative Strength Index (RSI) on March 5 was almost oversold, implying an upward probable price correction. Moreover, on the same day the Moving Average Convergence Divergence (MACD) displayed a positive crossing, therefore confirming the likelihood of an upcoming increasing trend.
- Check out our free forex signals
- Follow the top economic events on FX Leaders economic calendar
- Trade better, discover more Forex Trading Strategies
- Open a FREE Trading Account
Related Articles
Comments
Sidebar rates
Related Posts
