


Gold Prices Face Key Resistance at $2,900—Will Bulls Regain Control?
Gold prices dipped on Tuesday as traders assessed the economic impact of new U.S. tariffs on Canada, Mexico, and China.

The move, which includes a 25% levy on Mexican and Canadian imports and a doubling of duties on Chinese goods to 20%, has rattled global markets.
Financial analyst Kyle Rodda of  The future of trading noted that while gold remains in an uptrend, this pullback could deepen into the $2,700s before a fresh rally takes hold. “The weakening dollar and global trade uncertainty provided a strong boost overnight, but we may see further downside before the next leg higher,” Rodda said.
China quickly retaliated, announcing 10%-15% tariffs on U.S. imports starting March 10, along with new export restrictions on certain U.S. entities. These developments have fueled concerns about a prolonged trade war, adding volatility to metals markets.
Inflation Fears vs. Fed Rate Policy—A Balancing Act
Gold, which has gained 10% year-to-date, continues to attract safe-haven demand amid rising inflation risks. However, these same inflationary pressures could force the Federal Reserve to maintain higher interest rates for longer, which typically dampens gold’s appeal.
JPMorgan maintains a long-term bullish view, forecasting gold could reach $3,000/oz by Q4 2025.
The ADP employment report on Wednesday and Friday’s Non-Farm Payrolls (NFP) data could provide fresh insights into the Fed’s next move.
A strong labor market report could reinforce the Fed’s hawkish stance, pushing gold lower, while weaker employment data may revive rate-cut expectations, offering support.
Gold Technical Outlook—Key Levels to Watch
Gold (XAU/USD) is trading at $2,899.60, attempting to hold above the pivot point at $2,893.92. However, the 50-period Simple Moving Average (SMA) at $2,909.34 remains a key resistance level, limiting upside movement.
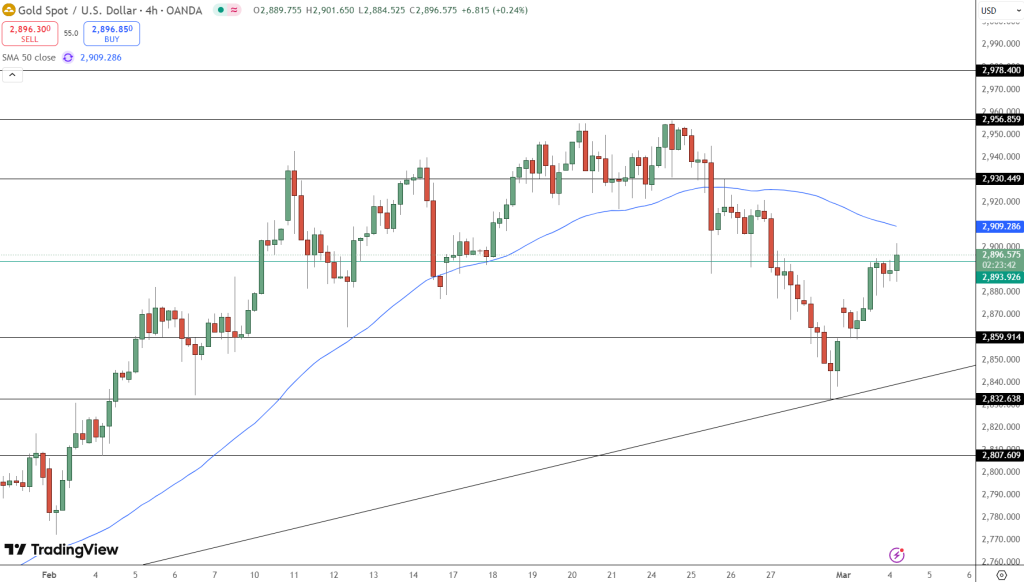
Immediate resistance: $2,909.34, followed by $2,930.44 and $2,956.85.
Immediate support: $2,859.91, with downside risks extending to $2,832.63 and $2,807.60.
A break below $2,859 could signal further weakness, while a breakout above $2,909 could reignite bullish momentum.
Traders should monitor volume and momentum indicators for confirmation of strength or a potential reversal, as gold remains caught between inflationary tailwinds and Fed-driven headwinds.


Sidebar rates
Related Posts
Add 3440

