


Forex Signals Brief February 28: Will PCE Inflation Help the USD Rally?

Yesterday the USD jumped 1 cent higher, while today the US PCE inflation report might extend the bullish move.
Today’s Market Expectations
The day started with some important data rom Japan. Tokyo’s consumer price index (CPI) for February rose by 2.9% year-over-year, falling short of the expected 3.2% and down from the previous reading of 3.4%. The core CPI, which excludes fresh food, increased by 2.2%, slightly below the forecasted 2.3% and lower than the prior 2.5%. Meanwhile, the CPI excluding both food and energy remained at 1.9%, aligning with the previous figure but just below the anticipated 2.0%.
The month-over-month (M/M) measure remains steady at 0.3%, the same as the previous reading, while the US PCE year-over-year (Y/Y) is expected to come in at 2.5%, slightly lower than the prior 2.6%. The core PCE M/M figure has risen to 0.3% from 0.2%, whereas the Core PCE Y/Y is forecasted at 2.6%, down from 2.8% previously.
Since CPI and PPI figures provide a solid basis for estimating PCE, the market typically anticipates the outcome in advance. However, yesterday’s GDP report showed a higher inflation reading which was another reason for the strong USD, so today we might see a stronger PCE number.
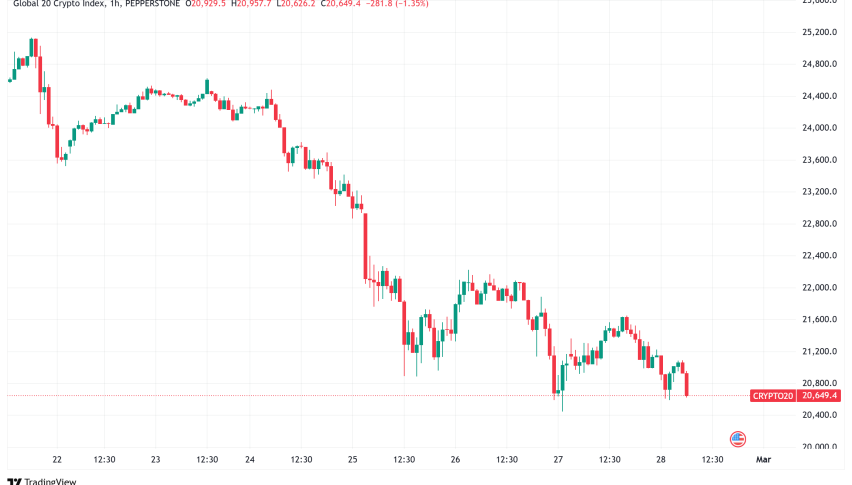
Yesterday USD buyers returned again, and the volatility increased, particularly in Gold, with some massive declines, which should have caught many gold traders on the wrong side. Cryptocurrencies continued to decline, while stock markets closed mixed, while Gold continued to crawl higher after Tuesday’s decline.
Gold Breaks Below the 20 SMA
Gold recently broke through the 20 and 50 SMAs, which had acted as support since early 2025, but its rally on the H4 chart met resistance. The price stabilized at the 100 SMA after a strong upward move. Over the past year, gold has surged nearly 50%, climbing from around $2,000 at the start of 2024. Shifting risk sentiment has been a major driver, with investors continuously pushing prices to new record highs. Earlier this week, gold set another all-time high at $2,956 before experiencing a sharp pullback below $2,900. However, it quickly rebounded from the 100 SMA, gaining $20 once again.
XAU/USD – H4 Chart
AUD/USD Tumbles on China Tariffs News
The Australian dollar has been under pressure against the US dollar since October of last year, primarily due to a stronger USD. The 20 SMA on the weekly chart has acted as resistance, and despite a brief recovery in February, AUD/USD has struggled to sustain levels above 0.64. The pair has remained below this threshold for the past two weeks, with the stochastic indicator signaling overbought conditions. Earlier this month, AUD/USD dropped below 0.61, revisiting levels last seen during the peak of the 2020 pandemic and breaking below its 2022 lows. However, as the US dollar weakened and tariff concerns eased, the pair staged a strong rebound. AUD/USD – Daily Chart
Cryptocurrency Update
Bitcoin Decline Stalls at the 200 Daily SMA

BTC/USD – Daily chart
Ethereum Sellers Face Support
Ethereum has also come under heavy selling pressure after surpassing $4,000 in late 2024. On Monday, ETH experienced a flash crash, briefly dropping below $2,000 and losing half of its value. Despite the bearish outlook, Ethereum has managed to stay above this key support level. However, with renewed downward momentum, the price is now approaching that crucial area once again. ETH/USD – Daily Chart


Sidebar rates
Related Posts
Add 3440


