Ethereum Plunges 22% to 14-Month Low Around $2,100 as Market Sentiment Deteriorates
Ethereum (ETH) has tumbled to a 14-month low of $2,150, marking a steep 20% decline over the past week as broader risk aversion grips crypto
Live ETH/USD Chart

Ethereum (ETH) has tumbled to a 14-month low of $2,150, marking a steep 20% decline over the past week as broader risk aversion grips cryptocurrency markets amid economic uncertainty and institutional selling.
Ethereum’s Institutional Selling Accelerates Decline
Add to Ethereum’s pricing problems substantial institutional selling pressure. Indicating market distribution, BlackRock, the biggest asset manager worldwide, has sent 30,280 ETH to Coinbase Prime in four different transactions. This aligns with more general outflows from Ethereum ETFs, BlackRock’s iShares Ethereum Trust alone dumping around $70 million worth of ETH. Together, Fidelity, Grayscale, and Bitwise have taken $24.5 million out of their Ethereum accounts.
With the Crypto Fear and Greed Index falling to 10, indicating “extreme fear” – a sentiment level not seen since the market fall of 2022—this institutional retreat comes as deratives markets show early signs of stability even with these significant sales.
ETH Derivatives Data Offers Some Hope
Ethereum’s derivatives market shows unexpected endurance even with the price slump. Up somewhat from 6% two days ago, the 30-day ETH futures currently trade at a 7% premium over the spot market. Considered neutral, premiums ranging from 5% to 10% indicate less bearish pressure below $2,600.
Comparatively, the ETH options tilt at -2%, quite within the neutral range of -6% to 6%. With no notable rush to buy defensive put options, this implies whales and market makers remain confident even with the dramatic price decline. This trend reflects market behavior from February 3, when ETH quickly recovered following a comparable 38% drop.
Macroeconomic Headwinds Weighing on ETH Price
The battle Ethereum faces coincides with worsening macroeconomic times. Recent U.S. economic data has caused worries; unemployment claims for the week ending February 22 reach a seasonally adjusted 242,000, the highest in three months. With a 4.6% reduction from the previous month, January’s pending home sales dropped to a record low, much below the 1.3% dip experts had predicted.
With fears of a 25% tariff on European Union imports, market concern has escalated as President Donald Trump announced additional import taxes aiming at commodities from China, Canada, and Mexico. To any unjust trade barriers, the EU has committed a “firm and quick response”. With money pouring into U.S. Treasuries and the currency, these legislative changes have drove investors into safe-haven assets.
Even market darling Nvidia saw its shares tumble 3.3% after surpassing quarterly estimates, underscoring investor anxiety in both conventional and cryptocurrency markets.
ETH/USD Technical Analysis
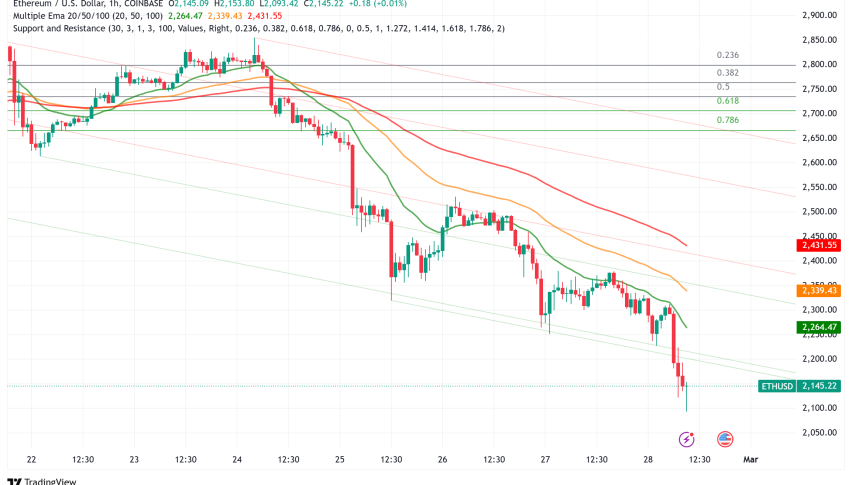
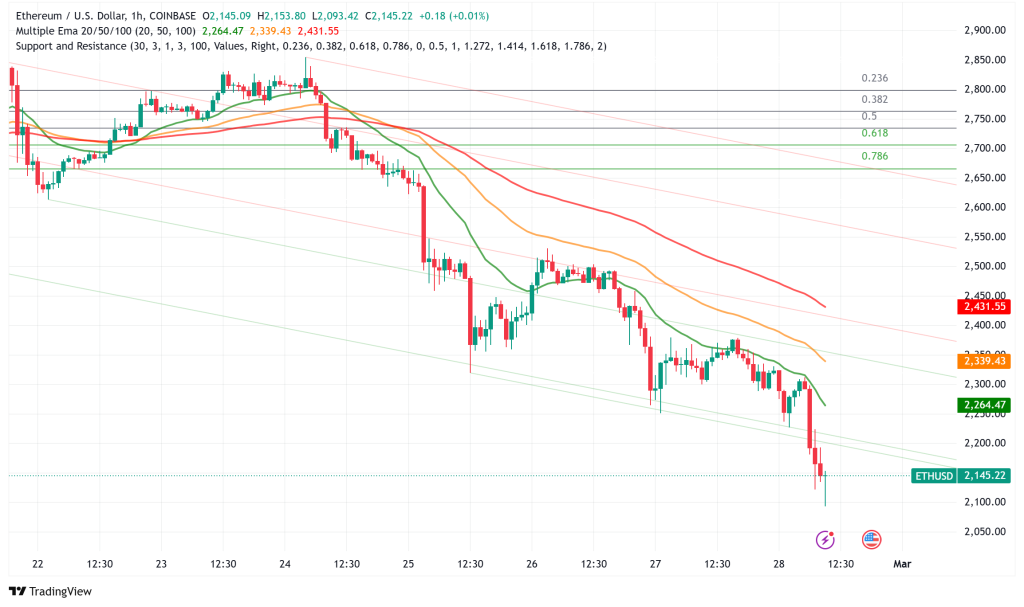
Once below key price levels, the second-largest cryptocurrency in the world by market capitalization has failed to attract support. Since late 2023, ETH/USD has not traded at these levels; the price has stabilised around $2,300 following first declining to a low of $2,123 on Thursday. With around $220 million lost throughout the crypto market in recent hours, this fast fall has set off significant liquidations.
Technical markers present a worrying picture. Deeply in oversold area, Ethereum’s Relative Strength Index (RSI) on the daily chart has dropped to 27. Although this points to a possible bounce, traders remain wary since the RSI might stay at these levels during protracted corrections.
Ethereum falling much below both this level and the 100-hourly Simple Moving Average, the hourly chart shows a negative trend line building with resistance near $2,260. Should ETH fail to recover the $2,250 resistance zone, another fall below $2,050—or perhaps even $2,000—becomes likely. Should this support prove insufficient, analysts propose testing the $1,105 weekly support level.
Potential Catalysts for Recovery
While Ethereum’s near-term outlook remains challenging, several factors could support a recovery in the coming months:
- Competitor Weaknesses: Solana’s declining momentum in the memecoin sector could redirect investor attention back to Ethereum.
- Ecosystem Dominance: Ethereum maintains its leadership in total value locked (TVL), driven by strong demand for liquid staking, lending, yield aggregators, and automated onchain liquidity protocols.
- Academic Investment: The Ethereum Foundation recently announced $2 million in grants for academic research related to the blockchain, with proposals due by March 16, 2025. This third annual Academic Grants Round seeks projects across disciplines including economics, cryptography, consensus protocols, security, and humanities.
- Technical Developments: Ethereum’s path to recovery depends largely on delivering planned upgrades and fostering incentives for projects to develop layer-2 solutions, which would enhance the base layer’s utility and strengthen staking rewards.
Ethereum Price Forecast
Although Ethereum may bounce back to $2,800 in the next months, given the state of the macroeconomics right now, experts estimate the trip may take some time. Reaching the $2,350 resistance level again comes first, then $2,450.
Market players are eagerly watching forthcoming U.S. inflation data for now; if it “surprises to the downside,” this might inspire hope. Ethereum most certainly remains volatile with a bearish inclination until more general economic concerns pass or institutional outflows settle.
- Check out our free forex signals
- Follow the top economic events on FX Leaders economic calendar
- Trade better, discover more Forex Trading Strategies
- Open a FREE Trading Account
Related Articles


Comments
Sidebar rates
Related Posts
