Bitcoin at $86K: 1.0 SOPR Test, $245M Liquidations, and $81K–$85K Support Key to Next Move

Bitcoin (BTC) finds itself at a critical juncture as technical and on-chain indicators converge to suggest that the world’s largest cryptocurrency is testing a key boundary between bearish and bullish momentum.
With BTC/USD currently trading in the mid-$80,000s, analysts are closely monitoring whether this momentary equilibrium can spur a decisive breakout or if further downside pressure will prevail.
Bitcoin’s On-Chain Signals: SOPR Nearing a Tipping Point
A key metric attracting attention is the Bitcoin Short-Term Holder Spent Output Profit Ratio (SOPR), which measures whether investors—specifically those who have held BTC for less than 155 days—are selling at a profit or a loss.
Historically, a SOPR value above 1.0 indicates profit-taking, while values below 1.0 suggest loss selling. Recently, the SOPR has been retesting the critical 1.0 mark, a level that, when breached, could either signal a bullish shift or trigger further panic among short-term holders who are eager to recoup losses.
As noted by on-chain analytics, breaking above this boundary has, in the past, heralded renewed upward momentum, but failure to sustain the move may lead to intensified sell pressure.
BTC/USD Technical Chart Patterns and Key Support Levels
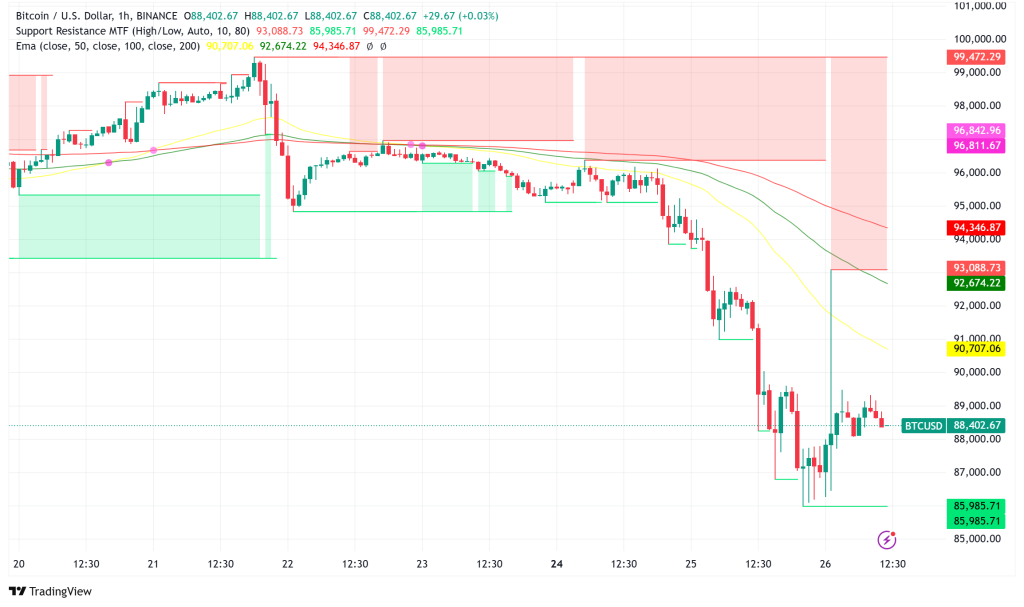
Recent price action has been anything but benign. After weeks of consolidation, Bitcoin experienced a sharp correction—dropping from highs above $95,000 to a 3‑month low near $86,000. This sudden decline wiped out approximately $245 million in leveraged long positions, raising concerns over the resilience of the $90,000 support level that had previously held firm.
Technical analysts have identified several important factors:
- Double-Top Pattern Confirmation: Bitcoin’s daily candles closed below the $92,000 threshold, confirming a long-standing double-top pattern. With an estimated drawdown of around 16% from the neckline, technical watchers have set their sights on a support region between $81,000 and $85,000. A failure to hold these levels could see BTC slide further to the CME gap between $77,000 and $80,000, which would validate the double-top target.
- Liquidity Gaps and Bidding Zones: A fair value gap formed between approximately $81,700 and $85,100 remains unfilled. Spot bid clusters identified on major exchanges, such as Binance, suggest that this zone may attract significant buying interest, potentially creating a dead cat bounce in the short term.
- Whale Activity: Despite the widespread sell-off, data indicates that institutional players and whales are accumulating Bitcoin. For instance, on-chain analysis reveals that around 26,430 BTC were transferred into whale accumulation addresses as investors with a longer-term outlook reposition themselves. Additionally, the average entry price for whales—hovering near $89,600—could serve as a psychological support level, providing a stabilizing force if the market finds some footing.
Broader Market Sentiment and Macroeconomic Influences
While technical charts offer clues about short-term price movements, broader macroeconomic factors are also at play. Investor sentiment has been rattled by global economic uncertainties, including inflation concerns and policy shifts such as the reintroduction of tariffs by the Trump administration.
Weakening U.S. consumer confidence and the flight into safe-haven assets like U.S. Treasuries have further compounded the risk-off sentiment across markets.
Despite these challenges, some analysts urge patience. Reference to Bitcoin’s historical post-halving performance hints that the most substantial leg of its bull market rally may still lie ahead, suggesting that current oversold conditions could eventually provide an attractive entry point for long-term investors.
Bitcoin Outlook: A Pivotal Decision Point
The immediate future for Bitcoin hangs in a delicate balance. Should the SOPR break decisively above 1.0 and the asset hold near the $89,600 psychological level, a bullish recovery could be on the horizon. On the contrary, a failure to sustain these levels might trigger further downside, pushing BTC closer to the technical targets set by the double-top pattern.
In this environment of heightened uncertainty, traders are advised to adopt proactive risk management strategies—whether that means initiating short positions or strategically liquidating holdings—while long-term investors might view the current drawdown as a potential generational buying opportunity.
As Bitcoin continues to navigate this bear-bull boundary, the interplay between technical signals, on-chain metrics, and macroeconomic pressures will determine whether the cryptocurrency can chart a course for recovery or succumb to further sell-offs.

Sidebar rates
Related Posts
