Forex Signals Brief February 25: Geopolitics and Tariff Talks to Drive Markets Again

Geopolitics will continue to rattle markets today, while we also have to watch out for the Canadian GDP and German Japan CPI inflation reports.

The economic calendar was relatively quiet today, with the Dallas Fed Manufacturing Index being the sole data release. The index fell sharply to -8.3 from 14.1 last month, marking its lowest reading since September 2024. The disappointing data added to early stock market declines, pushing indices further into the red.
However, sentiment shifted in the latter half of the U.S. session, as stocks rebounded on positive developments regarding U.S.-Russia cooperation. Russian President Vladimir Putin acknowledged Donald Trump’s efforts to stabilize the political situation in Ukraine and support the country’s progress. This helped lift the Dow into positive territory, though the S&P 500 and Nasdaq remained lower by the close.
Forex and Commodities: Euro Struggles, Gold Surges
In the forex market, the EUR/USD experienced volatility but ultimately failed to sustain gains above the 1.05 level. Meanwhile, commodity-linked currencies, particularly the Canadian dollar (CAD), weakened as Trump reaffirmed his stance on imposing tariffs on Mexico and Canada.
GOLD continued its impressive rally, reaching another record high and moving closer to the $3,000 milestone as investors sought safe-haven assets amid global uncertainty.
Today’s Market Expectations
Looking ahead, U.S. consumer confidence is expected to come in at 103.0 points, slightly down from the previous reading of 104.1 points. While still within its established range since 2022, the latest survey indicates a second consecutive monthly decline. The Conference Board noted that “all five components of the index deteriorated, with consumer assessments of the current situation experiencing the largest decline.” Business conditions have worsened for the second straight month, and for the first time since September, views on the labor market have also turned negative. With ongoing economic and geopolitical uncertainty, market participants will be closely watching upcoming data releases and policy developments in the days ahead.
Yesterday the volatility wasn’t high but markets were uncertain and there were quite a few price reversals in many assets. Gold continued to remain bullish, so we remained long on XAU/USD as well, which proved to be a good strategy, while selling EUR/USD with a stop above the recent highs, after several failed attempts to hold gains above 1.05.
MAs Makes Another Record High
The GOLD market remains well-supported, with the 20-day and 50-day simple moving averages (SMA) acting as key levels for buyers on the H4 chart. These moving averages have consistently provided strong support, preventing deeper corrections and signaling persistent bullish sentiment. Last week, gold nearly touched $2,955, reinforcing its upward trajectory. While a minor retracement brought prices down to $2,916, the decline was short-lived as the 50-day SMA acted as a buffer against further losses.
XAU/USD – H4 Chart
USD/JPY Remains Below 150
The USD/JPY pair had a strong rally from 140 in September to 159 in January, gaining nearly 20 cents. However, the momentum has shifted, with the pair experiencing a steady decline for over a month. Initially, the 200-day SMA provided support on the daily chart, but that level was broken yesterday, pushing USD/JPY below 150. This breach of a critical support level raises concerns about further downside as traders reassess market conditions. If the downward trend continues, additional selling pressure may emerge, leading to further declines. USD/JPY – Daily Chart
Cryptocurrency Update
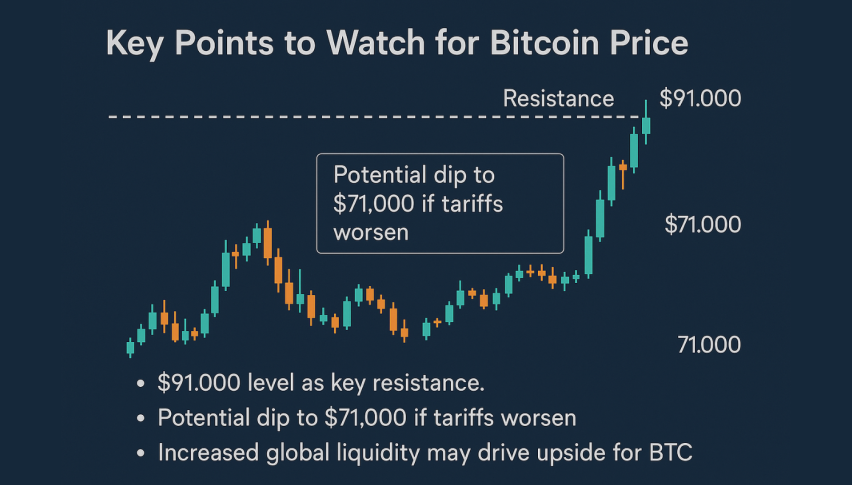
Bitcoin Breaks Below the 100 Daily SMA

BTC/USD – Daily chart
Ethereum Returns in the Range
Ethereum has faced persistent selling pressure since breaking above $4,000 in late 2024. A flash crash on Monday sent ETH tumbling below $2,000, briefly halving its value before recovering partially. Despite the bearish sentiment, Ethereum has held above the critical $2,000 support level. If market conditions improve, ETH could regain upward momentum and target higher price levels. ETH/USD – Daily Chart


Sidebar rates
Related Posts
