Bitcoin’s Make-or-Break Moment: Will It Hit $98.5K or Crash to $89K?
Bitcoin is currently at $95,700, with a market cap of $1.89 trillion and a 24-hour volume of $13.51 billion.

It has been ranging between $94,805 and $96,684, with mixed signals. Investors are watching key support and resistance zones as Bitcoin tries to settle.
| Broker | Review | Regulators | Min Deposit | Website | |
|---|---|---|---|---|---|
| 🥇 |  | Read Review | FCA, CySEC, ASIC, MAS, FSA, EFSA, DFSA, CFTC | USD 100 | Visit Broker |
| 🥈 | Read Review | FSCA, FSC, ASIC, CySEC, DFSA | USD 5 | Visit Broker | |
| 🥉 |  | Read Review | CySEC, MISA, FSCA | USD 25 | Visit Broker |
| 4 |  | Read Review | ASIC, BaFin, CMA, CySEC, DFSA, FCA, SCB | USD 200 | Visit Broker |
| 5 |  | Read Review | ASIC, FCA, CySEC, SCB | USD 100 | Visit Broker |
| 6 | Read Review | FCA, FSCA, FSC, CMA | USD 200 | Visit Broker | |
| 7 | Read Review | BVI FSC | USD 1 | Visit Broker | |
| 8 |  | Read Review | CBCS, CySEC, FCA, FSA, FSC, FSCA, CMA | USD 10 | Visit Broker |
| 9 |  | Read Review | ASIC, CySEC, FSCA, CMA | USD 100 | Visit Broker |
| 10 |  | Read Review | IFSC, FSCA, ASIC, CySEC | USD 1 | Visit Broker |
Technical Analysis: Resistance at $98.5K, Support at $94K
Daily Chart Overview
Bitcoin reached $109,356 before dropping to $89,164 and consolidating around $96,000.
Strong support between $89,000 and $91,000, resistance at $109,000.
Volume decline on the pullback means selling pressure is exhausted.
If Bitcoin breaks $98,500 with volume, it could go to $104,000 – $109,000.
Failure to hold current levels and it’s $89,000.
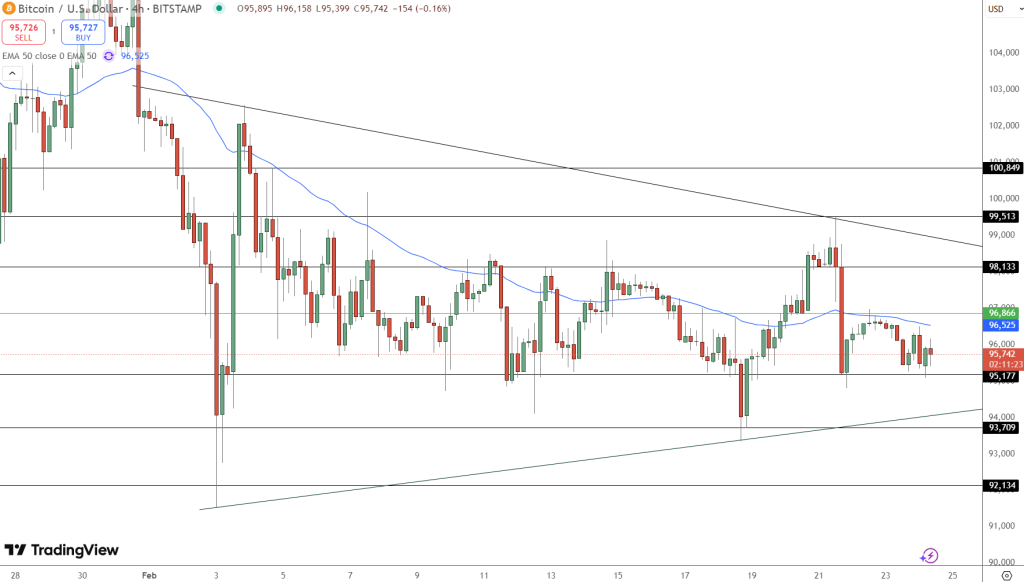
Four-Hour Chart Insights
BTC recovered from $93,340 to $99,508 but couldn’t hold it.
Resistance at $98,000 and $99,500, support near $93,000 – $94,000.
Re-test of $94,000 – $95,000 could be a buy opportunity for those looking for $98,000.
Below $93,000 and it’s $90,000 – $91,000.
One-Hour Chart: Short-Term Weakness
BTC dropped from $99,508 to $94,805 and then consolidated.
Resistance at $96,500 and $98,000, support at $94,000 – $95,000.
Look for dip-buying around $94,500 – $95,000 with tight stop-loss.
Indicators Signal Mixed Outlook
Relative Strength Index (RSI): 44 (neutral)
Stochastic: 45 (neutral)
Commodity Channel Index (CCI): -100 (neutral)
Momentum Indicator: -932 (slightly bullish)
MACD Level: -848 (bullish crossover potential)
Moving Averages:
Short-term bearish: 10-Period EMA ($96,599), 20-Period SMA ($96,601)
Long-term bullish: 100-Period & 200-Period MAs support higher targets
Bull & Bear Verdicts
Bull Case: Potential for $109K Rally
Holding above $94K is key for further up
MACD and momentum indicators suggest reversal
Break above $98,500 and it’s $104,000 – $109,000
Bear Case: Risk of Drop Below $89K
Failure to sustain gains suggests ongoing selling pressure
Break below $94K could push BTC toward $89K
Dominance of sell signals across multiple moving averages
Final Outlook
Bitcoin’s immediate trajectory hinges on whether it can reclaim $98,500 or succumb to renewed selling below $94,000. Traders should monitor volume levels closely to confirm the next major move in BTC’s price action.


Add 3442

Related Posts
Add 3440